Leawood is considered expensive in 2026, with a median home value of $592,700 creating a steep entry threshold despite a regional price index slightly below the national baseline. The value proposition depends on housing entry cost versus unusually low day-to-day friction—groceries and parks are broadly accessible, and walkable pockets reduce reliance on driving for errands more than the suburban form suggests.
Overall Cost of Living Snapshot
Is the true cost of living higher than you think? In Leawood, the answer hinges less on what you spend week-to-week and more on what it takes to get in the door. The city’s regional price parity index sits at 93, meaning the baseline cost of goods and services runs slightly below the national average. But that modest advantage disappears the moment housing enters the equation. With a median home value of $592,700 and median gross rent of $1,872 per month, the cost structure is defined by a single, dominant pressure point: securing a place to live.
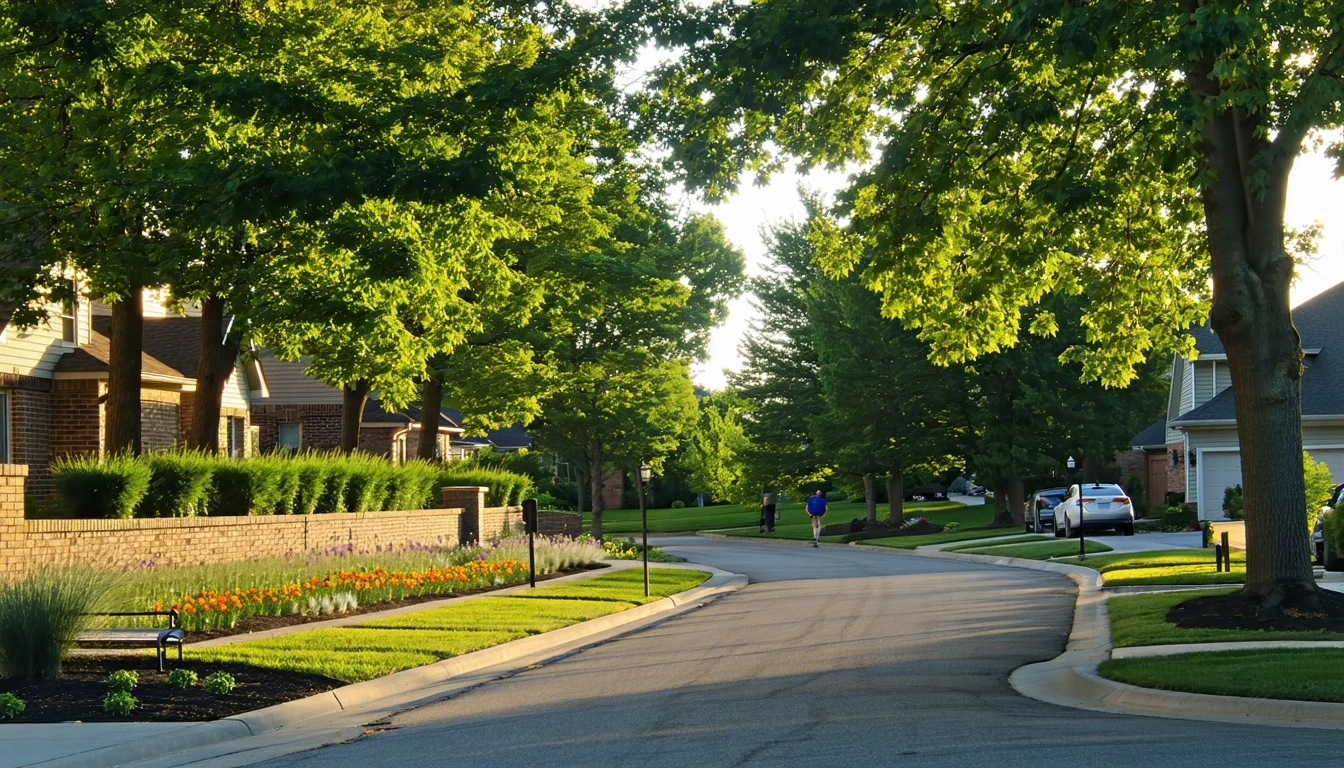
What surprises many newcomers is how little friction exists once that barrier is cleared. Food and grocery establishments exceed density thresholds across the city, park access is integrated throughout, and the pedestrian-to-road ratio is high enough to support walkable pockets—uncommon in suburban Kansas. The unemployment rate sits at 3.3%, and median household income reaches $174,779 per year, suggesting the local economy can support the housing premium. But the upfront cost remains the primary gatekeeper, and the city’s value proposition depends entirely on whether that entry price aligns with long-term plans.
The main cost driver is housing entry, not ongoing expenses. Utilities, transportation, and groceries contribute to monthly pressure, but none approach the magnitude of the initial housing commitment. The biggest surprise comes from day-to-day accessibility: this is not a place where every errand requires a car, and parks are woven into the residential fabric rather than isolated in distant corridors.
Housing Costs (Primary Driver)
Housing is the cost structure’s center of gravity. A median home value of $592,700 represents a steep climb for buyers, requiring substantial down payment capital and long-term income stability. For renters, $1,872 per month in median gross rent is elevated but more accessible than ownership on a month-to-month basis. The choice between renting and owning is not about lifestyle preference—it’s about liquidity, timeline, and risk tolerance.
Renting offers flexibility and lower entry friction, but it leaves households exposed to lease renewals and limits long-term equity capture. Owning locks in a fixed mortgage but demands significant upfront capital and exposes households to property tax adjustments, maintenance cycles, and insurance volatility. For households planning to stay long-term and able to clear the down payment threshold, ownership becomes the lower-risk path. For those prioritizing mobility or lacking access to capital, renting remains the only viable entry point.
This is a buying city for those who can afford the entry cost, and a transitional city for those who cannot. The rental market exists, but it serves a narrower band of households than ownership does.
| Housing Type | Cost Anchor | What That Buys You |
|---|---|---|
| Median Home Value | $592,700 | Ownership equity, fixed mortgage, long-term stability, exposure to maintenance and tax cycles |
| Median Gross Rent | $1,872/month | Lower entry barrier, month-to-month flexibility, no maintenance risk, no equity capture |
Utilities & Energy Risk
Utility costs in Leawood sit in moderate territory. Electricity runs 14.29¢ per kWh, close to national norms, while natural gas is priced at $12.56 per MCF—a rate that translates to moderate heating exposure during colder months. Current weather conditions (51°F, feels like 48°F) reflect the seasonal variability typical of the region: summers bring extended cooling demand, and winters require consistent heating, though neither season pushes into extreme climate territory.
The risk here is not catastrophic spikes but steady seasonal swings. Households in larger homes or older construction face higher exposure, particularly during peak heating and cooling months. Efficiency upgrades—insulation, programmable thermostats, HVAC maintenance—reduce usage and help stabilize bills, but the underlying volatility remains tied to weather patterns and natural gas market fluctuations.
Utility risk classification: moderate. Not the primary cost driver, but a recurring exposure that compounds over time, especially for homeowners managing long-term occupancy costs.
Groceries & Daily Costs
Grocery pricing in Leawood reflects the regional price parity index of 93, meaning food costs run slightly below the national baseline. Derived estimates based on that index suggest staples like bread, chicken, and eggs cost marginally less than in higher-cost metros, though the difference is subtle rather than transformative. (Derived estimate based on national baseline adjusted by regional price parity; not an observed local price.)
What matters more than individual item pricing is access. Food and grocery establishments exceed density thresholds across the city, meaning most households can reach multiple options without long drives or logistical friction. This reduces the hidden cost of time and fuel that often accompanies suburban grocery runs, and it creates competitive pressure that keeps pricing more transparent. For families managing frequent shopping trips, this accessibility translates into lower planning burden and fewer forced compromises between convenience and cost.
Transportation Reality
Transportation in Leawood operates on two tracks: commuting and daily errands. The average commute is 21 minutes, with 23.5% of workers facing longer trips and only 2.7% working from home. Gas prices sit at $3.27 per gallon, a moderate rate that still compounds quickly for households driving long distances five days a week. For most residents, car ownership is not optional—it’s the primary tool for reaching employment.
But daily errands tell a different story. The city’s pedestrian-to-road ratio exceeds high thresholds, and food density supports broadly accessible grocery options. Bus service is present, though with medium confidence in coverage and frequency. This means that while a car is likely required for commuting, it’s not necessarily the only way to handle day-to-day tasks. Walkable pockets exist, and households living near those areas face lower total vehicle dependency than the suburban form would suggest.
Transportation is a recurring exposure, but the intensity depends on commute length and household location. A single-vehicle household with two workers faces higher pressure than a dual-vehicle household with one remote worker. The cost is not just fuel—it’s insurance, maintenance, depreciation, and the time cost of long commutes. For households evaluating Leawood, the question is not whether to own a car, but how many miles that car will log each week.
Cost Exposure Profiles
Cost exposure in Leawood is shaped by three structural factors: housing entry method, commute length, and vehicle count. High-exposure households are those renting with long commutes, relying on a single vehicle, or lacking access to down payment capital. These households face compounding pressure: rent renewals without equity capture, high fuel and maintenance costs, and limited flexibility to absorb unexpected expenses.
Low-exposure households are homeowners with equity, dual-income stability, and proximity to employment or walkable errands. For these households, the upfront housing cost is a sunk threshold, and ongoing expenses are predictable and manageable. Families prioritizing school quality and park access find strong infrastructure here, which offsets the housing premium when viewed over a multi-year timeline.
The city does not exclude any household type outright, but it rewards those who can clear the housing entry barrier and minimize transportation dependency. The cost structure is front-loaded: once inside, day-to-day friction is lower than the suburban form suggests, but getting inside requires either significant capital or acceptance of rental exposure without long-term equity gain.
How this article was built: In addition to public economic data, this article incorporates location-based experiential signals derived from anonymized geographic patterns—such as access density, walkability, and land-use mix—to reflect how day-to-day living actually feels in Leawood, KS.
Frequently Asked Questions
Is Leawood more affordable than Overland Park in 2026? Leawood’s median home value of $592,700 is higher than many nearby suburbs, and its rental market is similarly elevated. Overland Park tends to offer a broader range of entry points, though specific comparisons depend on neighborhood and housing type.
What does a typical cost profile look like in Leawood? The dominant cost is housing—either a high purchase price or elevated rent. Utilities run moderate, groceries slightly below national baseline, and transportation depends heavily on commute length. Day-to-day errands are less car-dependent than typical suburbs due to high grocery density and walkable pockets.
Do utilities cost more in Leawood than nearby areas? Electricity at 14.29¢ per kWh and natural gas at $12.56 per MCF are near regional norms. Utility costs are moderate and driven more by seasonal demand than by rate premiums.
What costs tend to surprise newcomers in Leawood? The housing entry barrier is steeper than many expect, but day-to-day friction is lower. Walkable pockets, integrated parks, and broadly accessible groceries reduce the need for constant driving, which is uncommon in suburban Kansas.
Are property taxes higher in Leawood than Kansas City? Property tax structures vary by jurisdiction and assessed value. Leawood’s higher median home values mean tax bills can be substantial even at comparable rates, though specific comparisons require local tax authority data not provided here.
Is Leawood a good fit for renters long-term? Renting in Leawood offers lower entry friction than buying, but it limits equity capture and exposes households to lease renewals. For those planning to stay long-term, ownership becomes the more stable path if down payment capital is accessible.
How much does commuting add to monthly costs in Leawood? Commute costs depend on distance, fuel efficiency, and vehicle count. With gas at $3.27 per gallon and an average commute of 21 minutes, households driving long distances face compounding fuel, maintenance, and insurance expenses. The cost is recurring and scales with miles driven.
Does Leawood require two cars per household? Not necessarily. While car ownership is likely required for commuting, the city’s high grocery density and walkable pockets mean daily errands can often be handled on foot or with a single vehicle. Households with one remote worker or proximity to walkable areas may manage with one car, though most families find two vehicles more practical.