
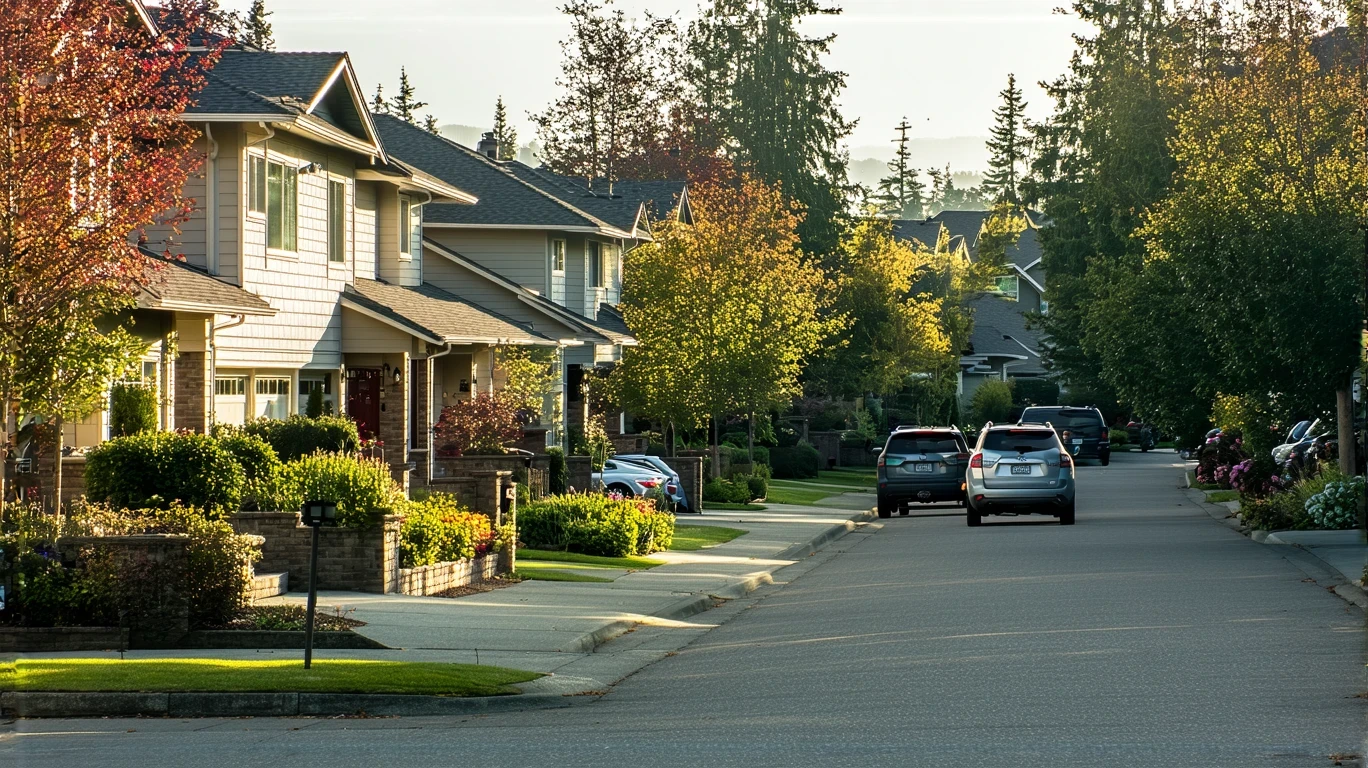
Redmond and Renton sit just miles apart in the Seattle metro, yet the way costs show up in daily life differs in ways that matter for households trying to decide where to settle in 2026. Both cities offer access to the broader region’s economy and amenities, but Redmond’s higher housing entry point and regional price premium create a different cost experience than Renton’s more moderate baseline paired with longer commute patterns. The decision isn’t about which city costs less overall—it’s about which cost pressures a household can absorb, which tradeoffs feel manageable, and how daily logistics align with income, schedule, and priorities.
Families weighing space needs against commute friction, couples balancing walkability against housing affordability, and single adults evaluating convenience spending versus baseline costs all face different calculus depending on which city they choose. Redmond’s walkable pockets, strong family infrastructure, and hospital presence create a different daily rhythm than Renton’s mix of moderate walkability, routine healthcare access, and car-dependent commute patterns. Understanding where cost pressure concentrates—and where flexibility exists—helps clarify which city fits which household in 2026.
Housing Costs: Entry Barrier vs. Ongoing Obligation
Housing dominates the cost experience in both Redmond and Renton, but the entry barrier and ongoing obligation differ substantially. Redmond’s median home value sits at $1,026,400, while Renton’s stands at $576,800—a structural difference that shapes who can access ownership and what monthly obligations look like once inside. For renters, Redmond’s median gross rent reaches $2,299 per month, compared to Renton’s $1,864 per month. These aren’t just price tags—they reflect different housing markets, different availability patterns, and different tradeoffs between space, location, and access to walkable infrastructure.
Redmond’s higher housing costs buy proximity to substantial pedestrian infrastructure, rail transit, and integrated green space—features that reduce car dependence and create convenience that shows up in daily errands, commute patterns, and household logistics. Renton’s lower entry point reflects a different structure: moderate walkability exists in pockets, rail service is present, but cycling infrastructure is less developed and commute times average 30 minutes, with 52.4% of workers facing long commutes. Households choosing Renton often trade housing savings for time spent commuting and greater reliance on cars for daily errands.
For first-time buyers, Redmond’s entry barrier requires substantially higher down payments and monthly mortgage obligations, even as median household income in Redmond ($155,287 per year) exceeds Renton’s ($92,292 per year). Renters in Redmond face higher baseline monthly obligations but gain access to neighborhoods where walkability reduces transportation friction. Renters in Renton experience lower monthly rent but often need reliable vehicles and must budget for longer commutes. Families seeking single-family homes with yards face tighter inventory and higher prices in Redmond, while Renton offers more accessible entry into detached housing—though often farther from transit and walkable amenities.
| Housing Type | Redmond | Renton |
|---|---|---|
| Median Home Value | $1,026,400 | $576,800 |
| Median Gross Rent | $2,299/month | $1,864/month |
| Median Household Income | $155,287/year | $92,292/year |
Housing takeaway: Households with incomes well above the regional median and priorities centered on walkability, transit access, and reduced car dependence may find Redmond’s higher entry barrier worthwhile. Households sensitive to upfront costs, seeking more accessible ownership, or willing to absorb commute time in exchange for lower monthly obligations will find Renton’s structure more flexible. The difference isn’t about affordability in the abstract—it’s about which cost pressure (entry barrier vs. commute friction) a household can manage.
Utilities and Energy Costs: Predictability and Seasonal Exposure
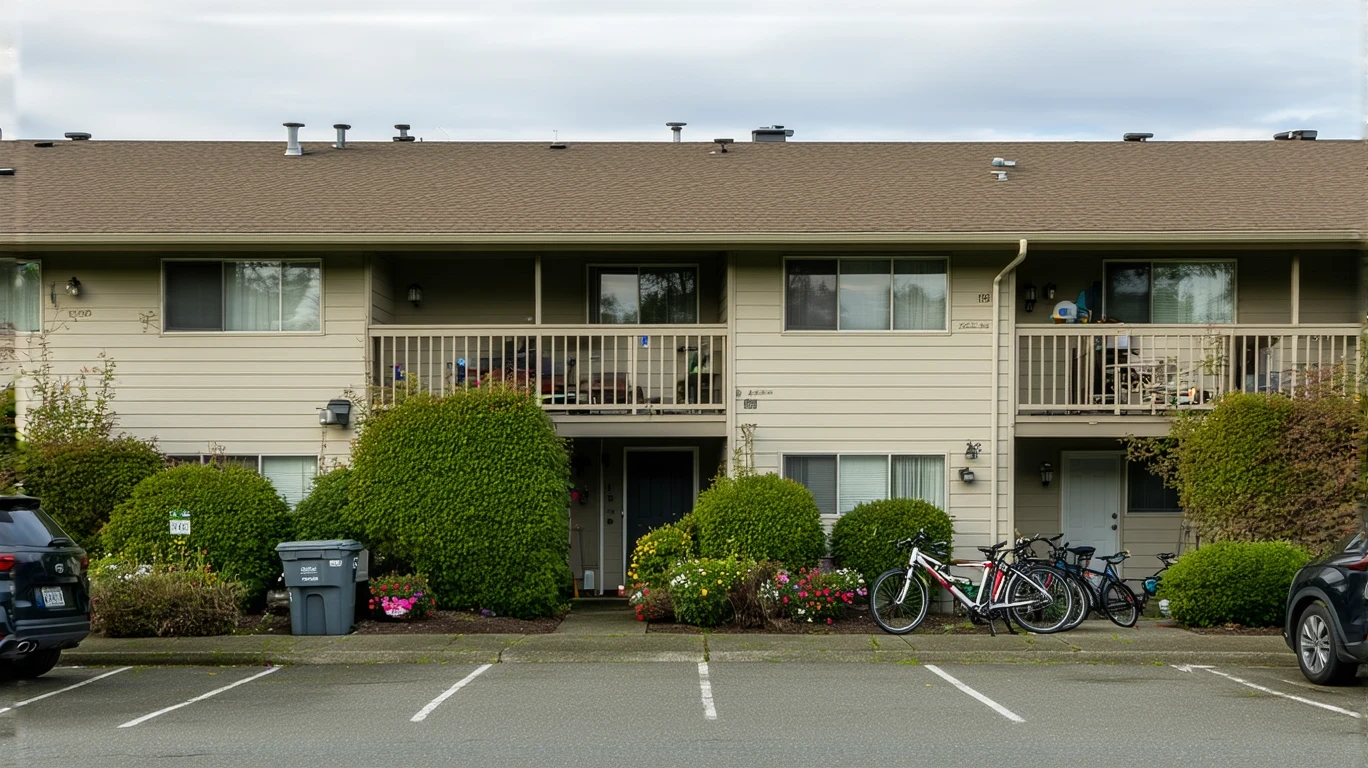
Utility costs in Redmond and Renton follow similar seasonal patterns, shaped by the Pacific Northwest’s mild, wet climate and reliance on electricity for heating and cooling. Redmond’s electricity rate stands at 14.11¢/kWh, while Renton’s is slightly lower at 13.33¢/kWh. Natural gas pricing shows a modest difference as well: Redmond pays $17.38/MCF, compared to Renton’s $15.51/MCF. These differences are small in isolation but compound over time, especially for households in larger homes or older housing stock with less efficient insulation and heating systems.
Seasonal exposure in both cities tilts toward heating rather than cooling, given the region’s temperate summers and cool, damp winters. Households in single-family homes—more common in Renton’s housing mix—face higher baseline usage than apartment dwellers, who benefit from shared walls and smaller square footage. Older homes in either city introduce more volatility, as drafty windows, aging HVAC systems, and poor insulation amplify heating costs during winter months. Newer construction, more prevalent in Redmond’s recent development, tends to offer better energy efficiency and more predictable monthly bills.
Household size and housing type interact with utility exposure in predictable ways. Single adults in apartments experience lower baseline usage and more stable bills, regardless of city. Families in detached homes face higher exposure, particularly during extended heating seasons when natural gas or electric heating runs continuously. Dual-income couples in townhomes or smaller single-family homes occupy a middle ground, with moderate usage and some ability to control costs through behavioral adjustments like programmable thermostats and off-peak usage.
Utility takeaway: Households in newer, smaller housing units experience more predictable utility costs in both cities, with Redmond’s slightly higher rates offset by more efficient housing stock in walkable pockets. Households in older, larger single-family homes—more common in Renton—face greater seasonal volatility and higher baseline usage, especially during winter heating months. The primary cost driver isn’t the rate itself but the interaction between housing type, home age, and household size.
Groceries and Daily Expenses: Price Sensitivity and Convenience Spending
Grocery costs reflect broader regional price differences between Redmond and Renton, driven by each city’s position within the Seattle metro’s economic geography. Redmond’s regional price parity index sits at 151, indicating costs run substantially above the national baseline, while Renton’s index of 113 suggests more moderate pricing. These differences show up in everyday staples: in Redmond, ground beef runs around $10.12/lb, milk costs approximately $6.14/half-gallon, and eggs reach roughly $3.55/dozen. In Renton, the same items cost about $7.62/lb, $4.55/half-gallon, and $2.82/dozen, respectively. (Derived estimates based on national baseline adjusted by regional price parity; not observed local prices.)
Both cities show high food establishment density and high grocery density, meaning households in either location have broadly accessible options for daily errands. Redmond’s walkable pockets and mixed land use create opportunities to run errands on foot or by bike, reducing reliance on cars and making quick trips less friction-heavy. Renton’s food and grocery access is similarly strong, but the city’s moderate cycling infrastructure and longer average commutes mean households often consolidate errands into car-based trips, which can encourage bulk buying at big-box stores rather than frequent smaller purchases at neighborhood markets.
Convenience spending—coffee shops, takeout, prepared foods—adds another layer of cost pressure that varies by household type and daily rhythm. Single adults in Redmond’s walkable neighborhoods may find themselves spending more on grab-and-go meals and coffee simply because options are visible and accessible. Families managing larger grocery volumes face different pressures: Redmond’s higher baseline prices mean weekly grocery bills add up faster, while Renton’s lower price floor offers more breathing room for households buying in bulk or cooking at home. Couples splitting costs may feel Redmond’s price premium less acutely than single-income households or families stretching budgets across multiple dependents.
Grocery takeaway: Households sensitive to baseline grocery prices and managing larger volumes (families, single-income households) will feel Redmond’s regional price premium more acutely. Households with flexibility in shopping habits, access to dual incomes, and willingness to pay for convenience may find Redmond’s walkable access to food options worth the higher per-item costs. Renton offers lower baseline prices and strong grocery access, but car-dependent errands can introduce time costs that offset dollar savings.
Taxes and Fees: Structural Differences Without Numeric Precision
Washington State’s tax structure relies heavily on sales taxes and property taxes, with no state income tax—a framework that affects Redmond and Renton households similarly in broad terms but differently in practice depending on housing type, consumption patterns, and length of ownership. Property taxes in both cities fund local services, schools, and infrastructure, with rates varying by assessed home value and local levies. Homeowners in Redmond face higher absolute property tax bills due to higher home values, even if effective rates remain comparable. Renters in both cities experience property taxes indirectly through rent, though the passthrough is less visible and harder to track.
Sales taxes apply uniformly across the region, meaning households in either city pay the same rate on taxable purchases. This structure shifts tax burden toward consumption rather than income, which can feel more regressive for lower-income households spending a higher share of income on goods and services. Households in Redmond with higher incomes may absorb sales tax exposure more easily, while households in Renton—where median income is lower—may feel sales tax pressure more acutely on large purchases like vehicles, appliances, or furniture.
Recurring fees introduce another layer of cost variability. Homeowners associations, more common in newer developments and townhome communities, can bundle services like landscaping, trash, and exterior maintenance into monthly or annual fees. These fees add predictability for some households (no surprise repair bills) but reduce flexibility for others (mandatory payments regardless of usage). Utility fees, parking permits, and other city-specific charges vary by neighborhood and housing type, with renters often shielded from direct exposure while homeowners manage these costs directly.
Taxes and fees takeaway: Homeowners in Redmond face higher absolute property tax obligations due to higher home values, while homeowners in Renton experience lower baseline property taxes but may face similar effective rates. Sales tax exposure affects both cities equally, but households with lower incomes feel the burden more heavily. Recurring fees—HOAs, utilities, parking—vary by housing type and neighborhood, with newer developments and townhome communities introducing more predictable but less flexible cost structures.
How People Actually Move Around Redmond and Renton
Daily mobility shapes cost exposure in ways that extend beyond gas prices and car payments. Redmond’s pedestrian-to-road ratio exceeds high thresholds, meaning substantial pedestrian infrastructure exists throughout parts of the city, making it possible to walk to errands, transit stops, and neighborhood amenities without defaulting to a car for every trip. Rail transit is present, and cycling infrastructure is notably developed, with bike-to-road ratios also exceeding high thresholds. These features don’t eliminate car ownership for most households, but they reduce the frequency of car trips and create flexibility in how people manage daily logistics.
Renton also shows walkable pockets and rail transit presence, but cycling infrastructure is less developed, with bike-to-road ratios in the medium band rather than high. The city’s average commute time sits at 30 minutes, and 52.4% of workers face long commutes—a pattern that reflects Renton’s role as a residential hub for workers commuting to Seattle, Bellevue, and other regional employment centers. Only 10.9% of Renton workers work from home, meaning the vast majority rely on cars or transit for daily commutes, and transit alone often doesn’t cover the full range of destinations households need to reach.
Gas prices in both cities reflect regional trends, with Redmond at $5.45/gal and Renton slightly lower at $5.26/gal. For households driving daily, these small differences compound over weeks and months, but the bigger cost driver is how often a car is needed. Households in Redmond’s walkable pockets may drive less frequently, reducing fuel costs, wear and tear, and parking friction. Households in Renton face more car-dependent daily patterns, meaning fuel costs, maintenance, and time spent commuting all add up as ongoing obligations rather than occasional expenses.
Transportation takeaway: Households prioritizing reduced car dependence, shorter commutes, and walkable access to errands will find Redmond’s infrastructure supports that lifestyle, even as housing costs run higher. Households willing to absorb longer commutes and greater reliance on cars in exchange for lower housing entry costs will find Renton’s structure more accessible, though time costs and fuel expenses become ongoing obligations rather than occasional line items.
Cost Structure Comparison: Where Pressure Concentrates
Housing pressure dominates the cost experience in both Redmond and Renton, but the nature of that pressure differs. Redmond’s higher entry barrier and ongoing monthly obligations reflect a market where walkability, transit access, and integrated amenities command a premium. Households choosing Redmond absorb higher upfront costs and monthly housing obligations in exchange for reduced car dependence, shorter errands, and access to strong family infrastructure and hospital presence. Renton’s lower housing entry point and moderate monthly obligations create more accessible ownership and rental options, but households trade housing savings for longer commutes, greater car reliance, and less developed cycling infrastructure.
Utilities introduce similar seasonal exposure in both cities, with heating costs driving winter volatility and housing type (apartment vs. single-family, newer vs. older construction) determining baseline usage more than city-level rate differences. Redmond’s slightly higher electricity and natural gas rates matter less than whether a household lives in a drafty older home or a well-insulated newer unit. Families in larger homes face higher exposure in either city, while single adults in apartments experience more predictable bills regardless of location.
Groceries and daily expenses reflect Redmond’s regional price premium, with staples costing more across the board. Households managing larger volumes—families, single-income households—feel this difference more acutely, while dual-income couples and smaller households may absorb the higher baseline more easily. Renton’s lower grocery prices offer breathing room for cost-sensitive households, though car-dependent errands can introduce time costs that offset dollar savings. Both cities offer broadly accessible food and grocery options, meaning the difference is less about availability and more about baseline pricing and convenience spending patterns.
Transportation patterns create divergent cost experiences. Redmond’s walkable pockets, rail transit, and notable cycling infrastructure reduce the frequency of car trips, lowering fuel costs, parking friction, and wear-and-tear expenses. Renton’s longer average commutes, higher share of long-distance commuters, and moderate cycling infrastructure mean most households rely on cars for daily logistics, making fuel, maintenance, and commute time ongoing obligations rather than occasional expenses. The difference isn’t just about gas prices—it’s about how often a car is needed and what that does to household schedules and flexibility.
The better choice depends on which costs dominate the household. Households sensitive to housing entry barriers but prioritizing walkability, transit access, and reduced car dependence may find Redmond’s structure worth the higher baseline. Households sensitive to monthly housing obligations, willing to absorb commute time, and comfortable with car-dependent logistics may find Renton’s lower entry point and moderate ongoing costs more manageable. For families, the difference is less about price and more about predictability: Redmond offers strong family infrastructure and hospital presence, while Renton offers more accessible housing with moderate school and playground density but routine healthcare access only.
How the Same Income Feels in Redmond vs Renton
Single Adult
For a single adult, housing becomes the first non-negotiable cost, and the difference between Redmond’s $2,299 median rent and Renton’s $1,864 median rent creates different levels of flexibility in everything else. In Redmond, walkable access to errands and transit reduces the need for a car, freeing up budget space that would otherwise go to fuel, insurance, and parking. In Renton, lower rent creates breathing room, but car dependence and longer commutes introduce time costs and fuel expenses that eat into flexibility. Convenience spending—coffee, takeout, prepared meals—adds up faster in Redmond due to higher regional pricing, while Renton’s lower baseline allows more room for discretionary spending or savings.
Dual-Income Couple
A dual-income couple faces similar housing pressure but splits costs across two earners, making Redmond’s higher rent or mortgage more manageable if both incomes are stable. Walkability and transit access reduce the need for two cars, lowering transportation costs and parking friction. In Renton, lower housing costs create more flexibility for saving, travel, or discretionary spending, but both partners likely need cars if commutes diverge or if errands require driving. Grocery costs run higher in Redmond, but smaller household size means the difference is less pronounced than for families managing larger volumes. The tradeoff centers on whether the couple values reduced car dependence and walkable convenience or prefers lower baseline housing costs with more driving.
Family with Kids
Families face compounding cost pressures in both cities, but the structure differs. In Redmond, higher housing costs buy access to strong family infrastructure—schools and playgrounds both meet density thresholds—and hospital presence, reducing friction in managing healthcare and childcare logistics. Walkable neighborhoods mean kids can access parks and schools without constant driving, though grocery costs and convenience spending add up faster with more mouths to feed. In Renton, lower housing entry costs create more accessible ownership, but moderate family infrastructure (schools meet thresholds, playgrounds fall below) and routine healthcare access only mean more driving for medical appointments and extracurriculars. Longer commutes for working parents add time pressure, making daily logistics more car-dependent and schedule-sensitive.
Decision Matrix: Which City Fits Which Household?
| Decision factor | If you’re sensitive to this… | Redmond tends to fit when… | Renton tends to fit when… |
|---|---|---|---|
| Housing entry + space needs | Upfront costs, down payments, monthly obligations | You can absorb higher entry barrier for walkability and reduced car dependence | You prioritize lower entry costs and accept longer commutes for more accessible ownership |
| Transportation dependence + commute friction | Commute time, fuel costs, car reliance | You value walkable errands, rail transit, and cycling infrastructure over driving flexibility | You tolerate longer commutes and car dependence in exchange for lower housing costs |
| Utility variability + home size exposure | Seasonal volatility, heating costs, energy efficiency | You prefer newer, smaller housing with more predictable utility bills | You accept higher seasonal exposure in older, larger homes for lower baseline housing costs |
| Grocery strategy + convenience spending creep | Baseline food prices, convenience spending, shopping frequency | You can absorb higher grocery prices for walkable access and reduced driving | You prioritize lower baseline grocery costs and consolidate errands into car-based trips |
| Fees + friction costs (HOA, services, upkeep) | Predictability vs flexibility, mandatory vs discretionary spending | You value bundled services and predictable fees in newer developments | You prefer lower baseline fees and accept more variability in maintenance and upkeep |
| Time budget (schedule flexibility, errands, logistics) | Commute time, errand friction, household logistics complexity | You prioritize shorter errands and walkable access over housing savings | You accept longer commutes and car-dependent logistics for lower monthly housing obligations |
Lifestyle Fit: Daily Rhythms and Household Logistics
Redmond and Renton offer different daily rhythms shaped by infrastructure, commute patterns, and access to amenities. Redmond’s walkable pockets and rail transit create opportunities to manage errands, commutes, and recreation without defaulting to a car for every trip. Parks and green space are integrated throughout the city, with park density exceeding high thresholds and water features adding to outdoor access. Families benefit from strong infrastructure—both schools and playgrounds meet density thresholds—and hospital presence means medical care is accessible without long drives. Cycling infrastructure is notably developed, making bike commutes and recreational rides practical for households prioritizing active transportation.
Renton’s lifestyle centers more on car-dependent logistics, with moderate walkability in pockets but less developed cycling infrastructure and longer average commutes. Rail transit is present, offering connections to Seattle and other regional hubs, but the city’s role as a residential base for commuters means most households spend significant time driving. Green space is similarly integrated, with park density exceeding high thresholds and water features present, offering outdoor recreation close to home. Family infrastructure is present but less robust than Redmond’s—schools meet density thresholds, but playground density falls below low thresholds. Healthcare access is routine and local, with clinics and pharmacies present but no hospital, meaning more serious medical needs require travel.
Cultural and recreational differences reflect each city’s economic base and regional role. Redmond’s higher median income and walkable mixed-use neighborhoods support a denser concentration of cafes, restaurants, and retail options, creating a rhythm where convenience and spontaneity are built into daily life. Renton’s more moderate income base and car-oriented layout mean recreation and dining often require intentional trips rather than impromptu stops. Both cities benefit from proximity to the broader Seattle metro’s cultural amenities—museums, theaters, professional sports—but daily life feels different depending on whether a household can walk to a coffee shop or needs to drive to run errands.
Redmond’s current temperature: 55°F (feels like 53°F)
Renton’s current temperature: 45°F (feels like 40°F)
Lifestyle tradeoffs extend beyond amenities to household logistics. Redmond’s walkable infrastructure and strong family amenities reduce the friction of managing school drop-offs, medical appointments, and grocery runs, making daily schedules more flexible. Renton’s lower housing costs create financial breathing room, but longer commutes and car-dependent errands add time pressure and reduce schedule flexibility. Households with young children, elderly parents, or complex medical needs may find Redmond’s hospital presence and walkable access worth the higher housing costs. Households prioritizing financial flexibility and comfortable with driving may find Renton’s structure more manageable.
Frequently Asked Questions
Is Redmond or Renton more affordable for families in 2026?
Affordability depends on which costs a family can absorb. Redmond’s higher housing entry barrier and ongoing monthly obligations are offset by strong family infrastructure, hospital presence, and walkable access that reduces car dependence. Renton’s lower housing costs create more accessible entry, but longer commutes, moderate family infrastructure, and routine healthcare access only mean more driving and time pressure. Families with stable dual incomes and priorities centered on walkability may find Redmond’s structure worth the higher baseline, while families sensitive to housing entry costs and comfortable with car-dependent logistics may find Renton more flexible.
How do grocery costs compare between Redmond and Renton in 2026?
Grocery costs run higher in Redmond due to the city’s regional price premium, with staples like ground beef, milk, and eggs costing more across the board. Renton’s lower regional price index translates to lower baseline grocery prices, offering breathing room for households managing larger volumes or stretching budgets. Both cities offer broadly accessible food and grocery options, meaning the difference is less about availability and more about baseline pricing and convenience spending patterns. Households sensitive to per-item costs will feel Redmond’s premium more acutely, while households prioritizing walkable access to errands may find the convenience worth the higher prices.
Which city is better for commuters working in Seattle in 2026?
Both Redmond and Renton offer rail transit connections to Seattle, but commute patterns differ. Redmond’s walkable pockets and notable cycling infrastructure reduce car dependence for daily errands, making it easier to manage without a car even if commuting by transit. Renton’s average commute time sits at 30 minutes, with over half of workers facing long commutes, reflecting the city’s role as a residential base for regional workers. Households prioritizing shorter commutes and reduced car dependence may find Redmond’s infrastructure more supportive, while households willing to absorb longer commutes for lower housing costs may find Renton’s structure more accessible.
Do Redmond and Renton have similar utility costs in 2026?
Utility rates are similar but not identical. Redmond’s electricity rate is slightly higher at 14.11¢/kWh compared to Renton’s 13.33¢/kWh, and natural gas pricing shows a modest difference as well. The bigger cost driver is housing type and home age—older single-family homes face higher seasonal exposure regardless of city, while newer apartments offer more predictable bills. Households in larger homes will face higher baseline usage in either city, while smaller households in well-insulated units experience more stable costs. The difference between cities matters less than the difference between housing types within each city.
What are the main lifestyle differences between Redmond and Renton in 2026?
Redmond’s lifestyle centers on walkable access, strong family infrastructure, and hospital presence, creating a rhythm where errands, recreation, and healthcare are less car-dependent. Renton’s lifestyle is more car-oriented, with moderate walkability in