Jurupa Valley is considered moderately priced in 2026, with a median home value of $481,500 and median rent of $1,618 per month. The value proposition depends on balancing housing entry cost against long-term vehicle ownership and commuting exposure.
Over the last five years, cost of living trends in inland Southern California communities like Jurupa Valley have been shaped by rising housing values, elevated energy rates, and persistent transportation dependence—forces that continue to define household budgets in 2026. Understanding what drives expenses here requires looking beyond sticker prices to the structural realities of how people actually live, move, and manage day-to-day logistics in a low-rise, car-oriented environment with selective pockets of walkability and rail access.
Overall Cost of Living Snapshot
Jurupa Valley sits at the national baseline for regional price parity, with an RPP index of 100, meaning the overall price level here mirrors the U.S. average. But that aggregate figure masks the real story: housing entry costs and transportation dependence create the primary financial pressure, while utilities add moderate seasonal volatility and groceries track close to national norms.
The median household income of $91,562 per year provides a reference point, but cost structure matters more than income alone. Homeownership dominates the local housing market, with a median value of $481,500 requiring substantial upfront capital and long-term financing commitment. For renters, the median gross rent of $1,618 per month offers a lower-barrier entry point, though the city’s layout and infrastructure still tilt heavily toward vehicle ownership as a recurring fixed cost.
Compared to more urbanized parts of Southern California, Jurupa Valley avoids the extreme housing premiums of coastal metros, but it also lacks the density and transit coverage that would reduce car dependency. The unemployment rate of 5.3% reflects a labor market with some slack, adding context to income stability and job mobility for households evaluating long-term affordability.
Driver verdict: Housing entry cost and vehicle ownership dominate financial structure. Surprises come from the interplay of moderate rent, elevated utilities, and the logistical burden of managing errands and commutes in a corridor-clustered, low-density environment where rail exists but daily tasks still favor driving.
Housing Costs (Primary Driver)
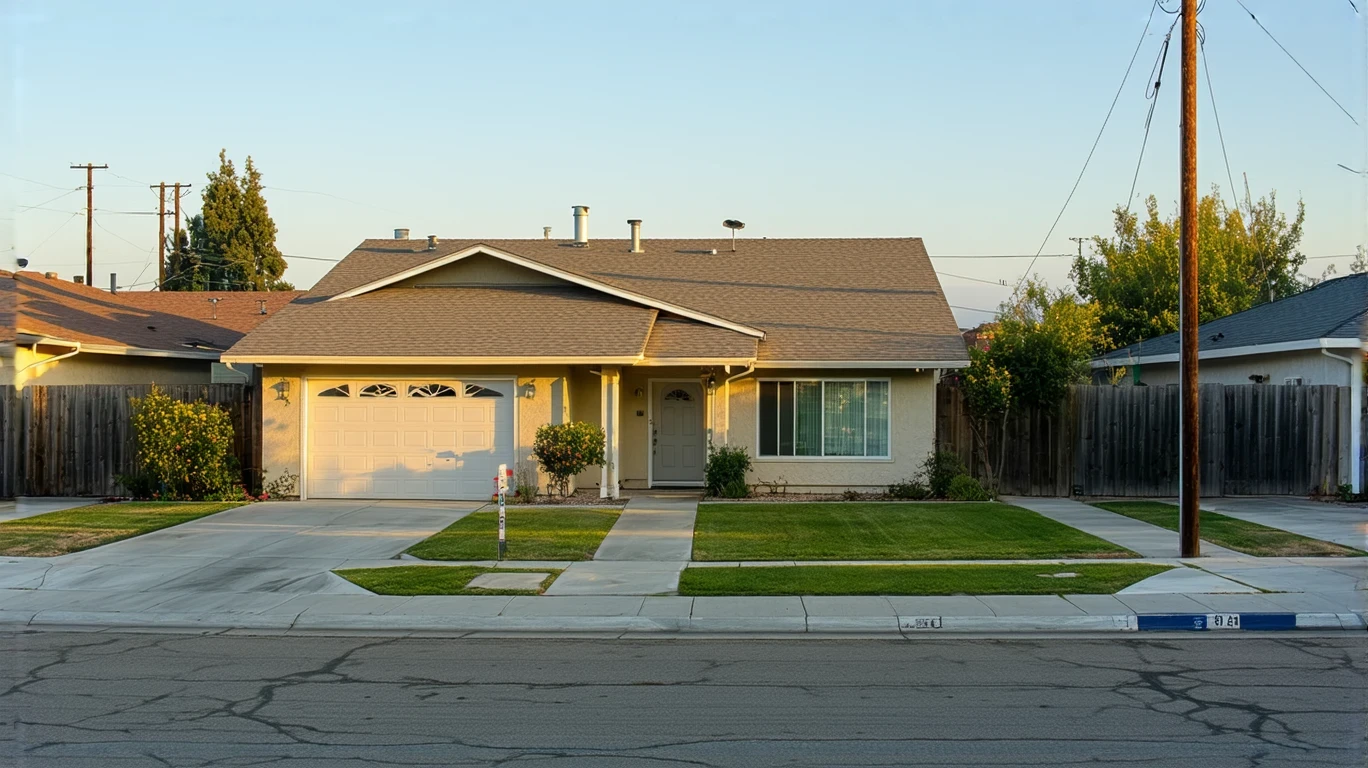
Housing is the anchor cost in Jurupa Valley, and the choice between renting and owning defines long-term financial exposure. The median home value of $481,500 reflects a market built around single-family ownership, supported by low-rise building character and mixed residential-commercial land use that spreads horizontally rather than stacking vertically. Buying here requires navigating down payments, mortgage financing, property taxes, insurance, and maintenance—costs that compound over time and respond to interest rate shifts, assessment changes, and climate-related insurance adjustments.
Renting, at a median of $1,618 per month, offers flexibility and lower upfront cost, but it also means exposure to lease renewals and landlord-driven rent adjustments. The rental stock here is limited compared to ownership inventory, and the city’s layout doesn’t favor the kind of dense, walkable apartment clusters that would create competitive rental markets with frequent turnover and diverse unit types.
The renting-versus-owning decision hinges on time horizon, capital availability, and tolerance for maintenance responsibility. Ownership builds equity but locks in property tax trajectories and repair obligations; renting preserves mobility but offers no hedge against future rent increases. Jurupa Valley functions as an ownership-dominant market, where renting is often a transitional step rather than a long-term strategy.
| Housing Type | Cost Anchor | What That Buys You |
|---|---|---|
| Median Home Value | $481,500 | Single-family ownership in low-rise, car-oriented setting; equity build but long-term tax and maintenance exposure |
| Median Gross Rent | $1,618/month | Lower entry cost, lease flexibility, but limited rental inventory and renewal risk |
Utilities & Energy Risk
Utilities in Jurupa Valley carry moderate risk, driven by elevated electricity rates and seasonal exposure to both cooling and heating. The electricity rate of 30.29¢ per kWh sits well above national averages, and in an inland Southern California climate with extended hot, dry summers, air conditioning becomes a necessity rather than a luxury. Current temperatures around 79°F in spring signal the onset of a long cooling season, where daily electricity demand climbs and stays elevated through fall.
Natural gas, priced at $23.78 per MCF (roughly equivalent to 100 therms), introduces winter heating exposure, though the climate here rarely demands the sustained, high-volume gas usage seen in colder regions. Still, the combination of elevated per-unit costs and seasonal swings means utility bills fluctuate more than in temperate coastal areas, and households without efficiency upgrades or behavioral adjustments face higher volatility.
The risk isn’t catastrophic, but it’s persistent. Homes with older HVAC systems, poor insulation, or west-facing exposure see sharper summer spikes. Renters in units where utilities aren’t included absorb this volatility directly, while owners can mitigate through insulation, programmable thermostats, and in some cases, solar installation—though upfront costs and permitting timelines vary.
Risk classification: Moderate. Elevated rates and extended cooling season create predictable but non-trivial exposure; households with control over efficiency investments fare better than those in older rental stock.
Groceries & Daily Costs
Grocery costs in Jurupa Valley track close to national baselines, with derived estimates reflecting regional price parity at 100. While specific item prices like bread at $1.85 per pound, chicken at $2.05 per pound, and milk at $4.03 per half-gallon provide reference points, the real story is about access and shopping patterns rather than per-item premiums.
Food and grocery establishments cluster along commercial corridors rather than distributing evenly across neighborhoods, a pattern confirmed by medium-density food and grocery access signals. This means households plan shopping trips around specific routes and anchor stores rather than walking to corner markets or neighborhood grocers. The layout favors bulk shopping and vehicle-based errands, which can reduce per-unit costs through volume buying but adds transportation time and fuel expense to the total cost of feeding a household.
For families, the combination of corridor-clustered grocery access and limited school density (below low threshold) compounds logistical complexity: errands, school runs, and meal planning all require coordination and vehicle use, turning grocery costs into a function of both food prices and the time-fuel burden of reaching stores.
Transportation Reality
Transportation in Jurupa Valley is a recurring fixed cost, not an occasional expense. The city’s low-rise, horizontally spread layout and corridor-clustered errands accessibility mean that most daily tasks—work commutes, grocery runs, school drop-offs, healthcare visits—require a vehicle. Rail transit is present, offering a commute alternative for workers traveling to regional employment centers, but the pedestrian-to-road ratio, while high in pockets, doesn’t extend across the full city, and bike infrastructure remains limited to some areas.
Gas prices at $5.84 per gallon amplify the cost of car dependency. Households with two vehicles, long commutes, or frequent errands face sustained fuel expenses that don’t fluctuate with season but do respond to regional and global oil markets. The absence of dense, walkable commercial districts means even short trips—picking up prescriptions, grabbing a gallon of milk—often require driving.
For households able to use rail for work commutes, transportation costs shift from fuel and mileage toward transit fares and parking, but this option depends on employment location and schedule alignment. For everyone else, vehicle ownership, insurance, maintenance, and fuel become non-negotiable line items, and the city’s layout offers little opportunity to reduce that exposure through walkability or bike commuting.
Transportation here isn’t just about getting around—it’s about the structural cost of living in a place where distance, not density, defines access.
Cost Exposure Profiles
Cost exposure in Jurupa Valley varies more by household structure and mobility patterns than by income alone. The dominant exposures are housing entry cost, vehicle dependence, and utility volatility, but how those pressures combine depends on whether you own or rent, how far you commute, and how many vehicles you operate.
Low-exposure situations: Renters with short commutes or remote work, single-vehicle households, and those living in newer, energy-efficient units face the most manageable cost structure. Rent at $1,618 per month avoids the capital and maintenance burden of ownership, and minimizing vehicle miles traveled reduces fuel and wear costs. Access to rail transit further lowers transportation exposure for work trips, though errands still require planning around commercial corridors.
High-exposure situations: Homeowners with long commutes, multi-vehicle households, and families managing school logistics in areas with limited school density face compounding pressures. Ownership locks in property tax and maintenance trajectories, multiple vehicles double fuel and insurance costs, and the need to coordinate errands across dispersed corridors adds time and mileage. Utility costs spike in older homes without efficiency upgrades, especially during extended cooling seasons.
The city’s layout amplifies these differences. Walkable pockets exist, but they don’t cover the full geography, and the corridor-clustered pattern for groceries and services means that convenience costs either time or fuel. Families with young children face additional logistical burden due to limited school density, requiring longer school runs or private transportation solutions.
Understanding cost exposure here means recognizing that housing and transportation aren’t separate categories—they’re linked by the city’s physical form, and the tradeoffs between rent and ownership, commute length and vehicle count, define financial sustainability more than any single price point.
How this article was built: In addition to public economic data, this article incorporates location-based experiential signals derived from anonymized geographic patterns—such as access density, walkability, and land-use mix—to reflect how day-to-day living actually feels in Jurupa Valley, CA.
Frequently Asked Questions
Is Jurupa Valley more affordable than Riverside in 2026? Jurupa Valley and Riverside share similar regional price pressures, but Jurupa Valley’s lower-density layout and corridor-clustered services can increase transportation costs even if housing entry is comparable. Affordability depends on commute patterns and vehicle dependence as much as rent or home prices.
What does a typical cost profile look like in Jurupa Valley? Housing and transportation dominate, with moderate utility volatility and grocery costs near national norms. Renters face lower upfront costs but ongoing lease risk, while owners absorb property taxes, maintenance, and insurance. Vehicle ownership is effectively mandatory for most households, adding fuel, insurance, and repair costs as recurring fixed expenses.
Do utilities cost more in Jurupa Valley than in nearby areas? Electricity rates at 30.29¢ per kWh are elevated compared to national averages and contribute to higher summer cooling costs in the extended hot season. Natural gas prices add moderate winter heating exposure, though the climate here is less extreme than interior or northern regions.
What costs tend to surprise newcomers in Jurupa Valley? Transportation often surprises households unfamiliar with car-dependent suburban layouts. Even with rail access, daily errands require vehicle use due to corridor-clustered grocery and service locations, and gas prices at $5.84 per gallon add up quickly for multi-vehicle households or long commutes.
Are property taxes higher in Jurupa Valley than in San Bernardino? Property tax rates in California are governed by Proposition 13, so the rate structure is similar across counties, but assessed home values drive total tax bills. Jurupa Valley’s median home value of $481,500 sets the baseline for annual property tax obligations, which grow with assessments and voter-approved local measures.
Can you live in Jurupa Valley without a car? Rail transit offers a commute option for some employment destinations, and walkable pockets exist in parts of the city, but the overall layout, corridor-clustered errands, and limited bike infrastructure make car-free living logistically difficult for most households, especially those managing family or healthcare needs.
How does the cost structure in Jurupa Valley compare to more urbanized parts of Southern California? Jurupa Valley avoids the extreme housing premiums of coastal metros like Los Angeles or Orange County, but it also lacks the transit density and walkable commercial districts that reduce car dependency. The tradeoff is lower housing entry cost in exchange for higher ongoing transportation exposure.
What drives the biggest cost differences between renters and owners in Jurupa Valley? Owners face higher upfront capital requirements, property tax and insurance obligations, and maintenance responsibility, but they build equity and avoid lease renewal risk. Renters pay less upfront and retain mobility, but they’re exposed to rent increases and have no control over property-level efficiency improvements that could lower utility costs.