Is Reynoldsburg expensive to live in? Reynoldsburg is considered moderately priced in 2026, with a median home value of $217,200 and median rent of $1,172 per month. The value proposition depends on housing entry cost versus car dependence—local errands are accessible, but most households still need reliable transportation.
When Maya signed her lease in Reynoldsburg, she expected the rent to be the hard part. What caught her off guard was the rhythm of everything else: the gas station visits that added up faster than she planned, the electric bill that spiked in July, the realization that her car wasn’t optional even though the grocery store was close. Reynoldsburg doesn’t announce its costs with sticker shock—it reveals them in layers, week by week, as you settle into the cadence of life here.
Overall Cost of Living Snapshot
Reynoldsburg sits below the national price baseline, with a regional price parity index of 95, meaning the overall cost structure runs about 5% lower than the U.S. average. That discount shows up unevenly: housing and groceries reflect it, but transportation and utilities don’t offer the same relief. The median household income of $68,778 per year provides context, but this article focuses on cost pressure points, not income sufficiency.
The housing pressure here is moderate but front-loaded. Ownership dominates the long-term cost picture, with the $217,200 median home value setting the entry bar. Renters face steady but not extreme monthly outlays at $1,172. What separates low-cost households from high-cost ones isn’t income—it’s structure: how many cars you run, how far you commute, whether you own or rent, and how much seasonal utility swings affect your planning.
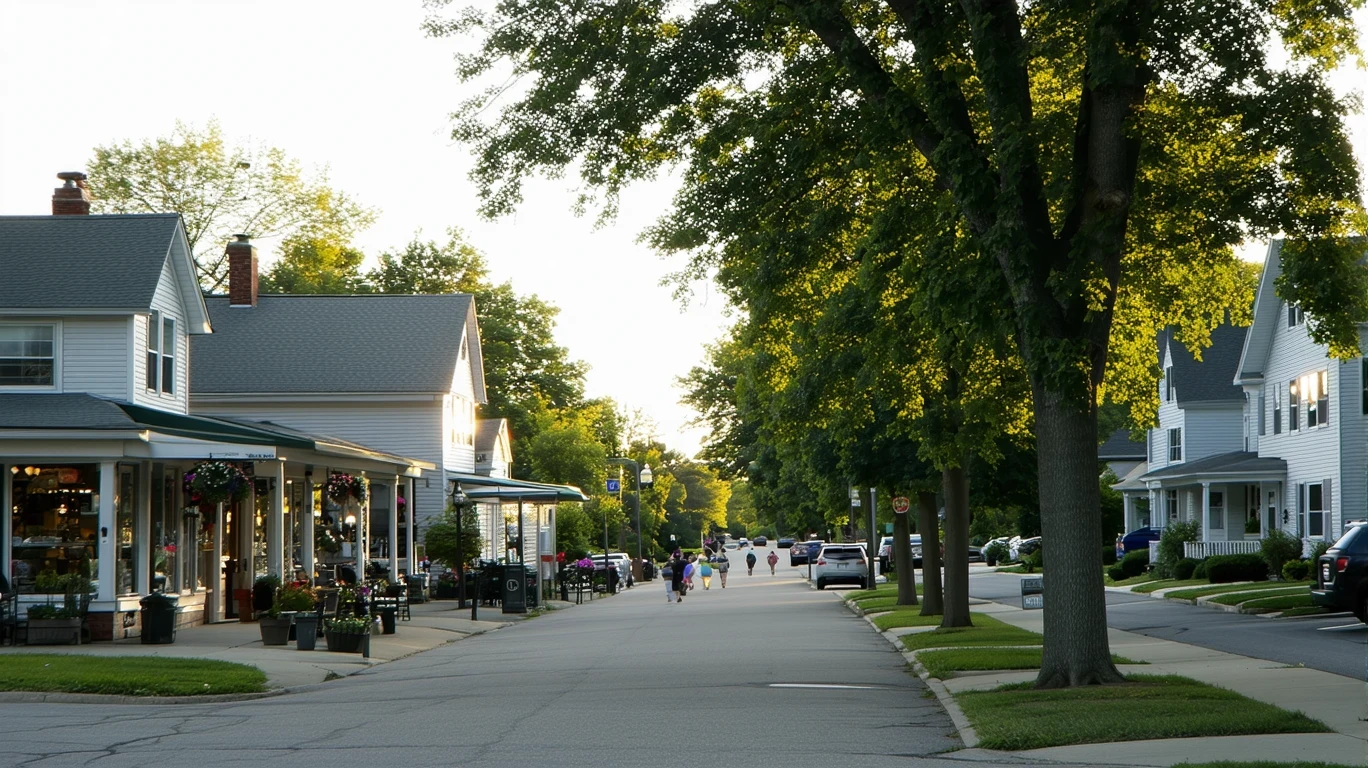
The biggest surprise for newcomers isn’t any single line item—it’s the car dependency that persists even when daily errands feel accessible. Food and grocery options exceed density thresholds across the city, and the pedestrian-to-road ratio supports some local movement on foot. But bus service, while present, doesn’t replace the need for a vehicle in most households. That creates a recurring transportation exposure that rivals housing in its cumulative weight.
Driver verdict: Housing entry cost and car dependency together define the cost ceiling. Day-to-day expenses (groceries, utilities) create moderate, predictable pressure. Surprises come from underestimating vehicle costs and seasonal utility swings, not from rent or food prices.
Housing Costs (Primary Driver)
Housing is the anchor. The $217,200 median home value places Reynoldsburg in the accessible-but-not-cheap tier for ownership. That figure reflects the upfront cost—down payment, closing, financing—but it also sets the floor for property taxes, insurance, and maintenance exposure over time. Ownership here is a long-term cost structure, not a monthly budget item, and it rewards stability more than flexibility.
Renters face a different calculus. At $1,172 per month, the median gross rent creates steady but manageable pressure for households earning near the median income. Rent doesn’t include the maintenance risk or tax exposure of ownership, but it also doesn’t build equity or lock in a fixed housing cost. The tradeoff is control versus predictability: renters avoid surprise repairs but face potential lease renewals with adjusted terms.
Reynoldsburg functions as a ownership-leaning city. The rental market exists and serves transitional households well, but the housing stock, low-rise building character, and land-use mix all tilt toward single-family ownership. If you’re planning to stay more than a few years, the math favors buying. If you’re testing the region or expect to move, renting preserves flexibility without locking you into a high monthly cost.
| Housing Type | Cost Anchor | What That Buys You |
|---|---|---|
| Median Home (Owner) | $217,200 | Equity build, tax/maintenance exposure, long-term cost control |
| Median Rental | $1,172/month | Flexibility, no repair risk, potential lease adjustment exposure |
Utilities & Energy Risk
Utilities in Reynoldsburg create moderate seasonal swings, not chronic high costs. Electricity runs 17.59¢ per kilowatt-hour, slightly above the national midpoint, while natural gas is priced at $11.25 per thousand cubic feet (MCF)—roughly equivalent to $1.13 per therm. Both fuels see active use here: cooling dominates summer months, heating takes over in winter.
For illustrative context, a household using around 1,000 kWh per month would face a baseline electric cost near $176 before fees and taxes during peak cooling months. Natural gas usage varies more sharply by season; a household using 1 MCF per month during heating season would see a baseline cost around $11 per MCF, though actual usage depends on home efficiency, thermostat settings, and winter severity. These figures are illustrative and exclude distribution fees, taxes, and seasonal rate adjustments.
The risk here isn’t the per-unit price—it’s the exposure to both heating and cooling seasons. Reynoldsburg sits in a climate zone where summer heat and winter cold both demand active climate control. That creates two cost peaks per year, and the gap between low-usage months and high-usage months can be significant. Households with older HVAC systems, poor insulation, or larger square footage face wider swings.
Risk classification: moderate. Utilities won’t dominate your cost structure the way housing or transportation might, but they add meaningful seasonal variability. The exposure is manageable with efficiency planning but not negligible.
Groceries & Daily Costs
Grocery costs in Reynoldsburg reflect the regional price parity index of 95, running slightly below the national baseline. The city’s food and grocery establishment density exceeds high thresholds, meaning access is broadly distributed rather than concentrated in a few corridors. That reduces the friction cost of shopping—you’re not driving across town to find options—but it doesn’t eliminate the line-item cost of food itself.
Derived estimates for common items include bread at $1.76 per pound, ground beef at $6.40 per pound, eggs at $2.38 per dozen, and milk at $3.82 per half-gallon. These figures are modeled from national baselines adjusted by regional price parity and do not represent observed local prices. They illustrate grocery pressure, not specific store pricing.
For most households, groceries create steady, predictable pressure rather than volatile swings. The cost difference between a low-grocery household (minimal processed foods, batch cooking) and a high-grocery household (convenience items, frequent prepared meals) is wider than the difference between Reynoldsburg and a nearby city. Behavior drives more variance than location.
Transportation Reality
Transportation in Reynoldsburg is a recurring cost exposure, not a one-time decision. The city’s infrastructure supports some local errands on foot—pedestrian-to-road ratios fall in the medium band, and food access is broadly distributed—but the overall mobility texture remains mixed. Bus service exists, but it doesn’t replace car ownership for most households. The result is a car-dependent baseline with pockets of walkable convenience.
Gas prices sit at $3.91 per gallon, slightly above the national average and a meaningful factor for households with long commutes or multiple vehicles. A household driving 25 miles round-trip daily at 25 miles per gallon would use about 1 gallon per day, translating to roughly $27–28 per week in fuel alone before maintenance, insurance, or depreciation. That’s illustrative context, not a budget forecast, but it shows how quickly transportation costs accumulate.
The unemployment rate of 4.0% suggests a stable local economy, but commute data is absent from the feed. What’s clear from the infrastructure signals is that getting around here still means owning a car for most people, even if some errands don’t require one. That creates a fixed cost floor—insurance, registration, financing or depreciation—plus variable fuel and maintenance exposure.
Transportation isn’t the largest single cost in Reynoldsburg, but it’s the one that scales fastest with household complexity. One car, short commutes, and local errands keep it manageable. Two cars, long commutes, and frequent out-of-town trips push it into a primary cost driver.
Cost Exposure Profiles
Cost pressure in Reynoldsburg doesn’t distribute evenly—it clusters around a few structural factors that separate low-exposure households from high-exposure ones. The city’s cost structure rewards stability, local employment, and single-car logistics. It penalizes long commutes, multi-vehicle dependence, and frequent healthcare needs that require travel beyond city limits.
Low-exposure households typically own their home (locking in the largest cost), work locally or remotely (minimizing fuel and vehicle wear), run one reliable vehicle, and use the city’s broadly accessible grocery and errands infrastructure to reduce trip frequency. Utilities create seasonal swings, but efficient homes and moderate usage keep the peaks manageable. These households experience Reynoldsburg as moderately priced and stable.
High-exposure households face a different reality: renting at or above the median (with potential lease adjustment risk), commuting long distances daily (multiplying fuel and maintenance costs), operating two or more vehicles (doubling insurance, registration, and depreciation), and traveling out of town for healthcare (no hospital or clinics detected locally, though pharmacies are present). Seasonal utility swings hit harder in larger or less-efficient homes. These households experience Reynoldsburg as more expensive, not because prices are higher, but because their structure amplifies every cost lever.
The difference isn’t income—it’s exposure. A household earning below the median but owning a home, working nearby, and running one car may face lower total cost pressure than a household earning above the median but renting, commuting far, and managing multiple vehicles. Reynoldsburg’s cost ceiling is set by how many high-exposure factors you carry, not by the city’s baseline prices.
Frequently Asked Questions
Is Reynoldsburg more affordable than Columbus in 2026? Reynoldsburg’s regional price parity index of 95 runs below the national baseline, and its median home value of $217,200 is lower than many Columbus neighborhoods, but transportation costs can offset housing savings depending on commute length and vehicle dependence.
What does a typical cost profile look like in Reynoldsburg? Housing (either $217,200 median home value or $1,172/month rent) anchors the structure, with transportation and utilities creating the next layer of recurring pressure. Groceries and day-to-day costs run slightly below national averages but don’t vary dramatically from nearby cities.
Do utilities cost more in Reynoldsburg than nearby areas? Electricity at 17.59¢/kWh sits slightly above the national midpoint, and natural gas at $11.25/MCF is moderate. The cost pressure comes more from seasonal demand (both heating and cooling active) than from per-unit pricing.
What costs tend to surprise newcomers in Reynoldsburg? Most people underestimate car dependency—even though grocery and errands access is strong, a vehicle remains necessary for work, healthcare, and broader services. Seasonal utility swings also catch renters off guard if they’re used to milder climates.
Are property taxes higher in Reynoldsburg than nearby suburbs? Property tax rates aren’t provided in the data, but the $217,200 median home value suggests moderate assessed values. Tax exposure depends on millage rates, school district funding, and local levies, which vary across Franklin County suburbs.
Is Reynoldsburg a good place for renters or buyers? The city tilts toward ownership—low-rise housing, mixed land use, and stable home values favor long-term buyers. Renters at $1,172/month face moderate costs and flexibility, but the market structure rewards ownership over time.
How does car ownership affect the cost of living here? Significantly. Gas at $3.91/gallon, combined with the need for at least one vehicle in most households, creates a recurring cost floor. Two-car households or long commuters see transportation rival housing as a primary cost driver.
What’s the biggest cost difference between living in Reynoldsburg versus a nearby rural area? Reynoldsburg offers broadly accessible groceries, mixed walkability, and bus service, which can reduce trip frequency and time costs. Rural areas may have lower housing entry costs but higher transportation exposure due to longer distances for errands, work, and services.
How this article was built: In addition to public economic data, this article incorporates location-based experiential signals derived from anonymized geographic patterns—such as access density, walkability, and land-use mix—to reflect how day-to-day living actually feels in Reynoldsburg, OH.