
Answer: Saint Paul is considered moderately priced in 2026, with cost pressure shaped more by housing entry decisions and transportation structure than by day-to-day expenses. The value proposition depends on whether you own or rent, and how much your household can leverage the city’s walkable pockets and transit access to reduce car dependency.
When Maya transferred to Saint Paul in early 2026, she expected Midwest pricing to feel straightforward. What surprised her wasn’t sticker shock—it was the tradeoff structure. Housing wasn’t wildly expensive, but ownership required commitment. Groceries tracked close to national norms. The real variable turned out to be transportation: her coworker who lived near a rail stop barely drove, while another who chose a cheaper place fifteen minutes out spent $400 a month on gas and parking. Saint Paul’s cost reality, she learned, wasn’t about whether the city was cheap or expensive—it was about which exposures you chose to carry.
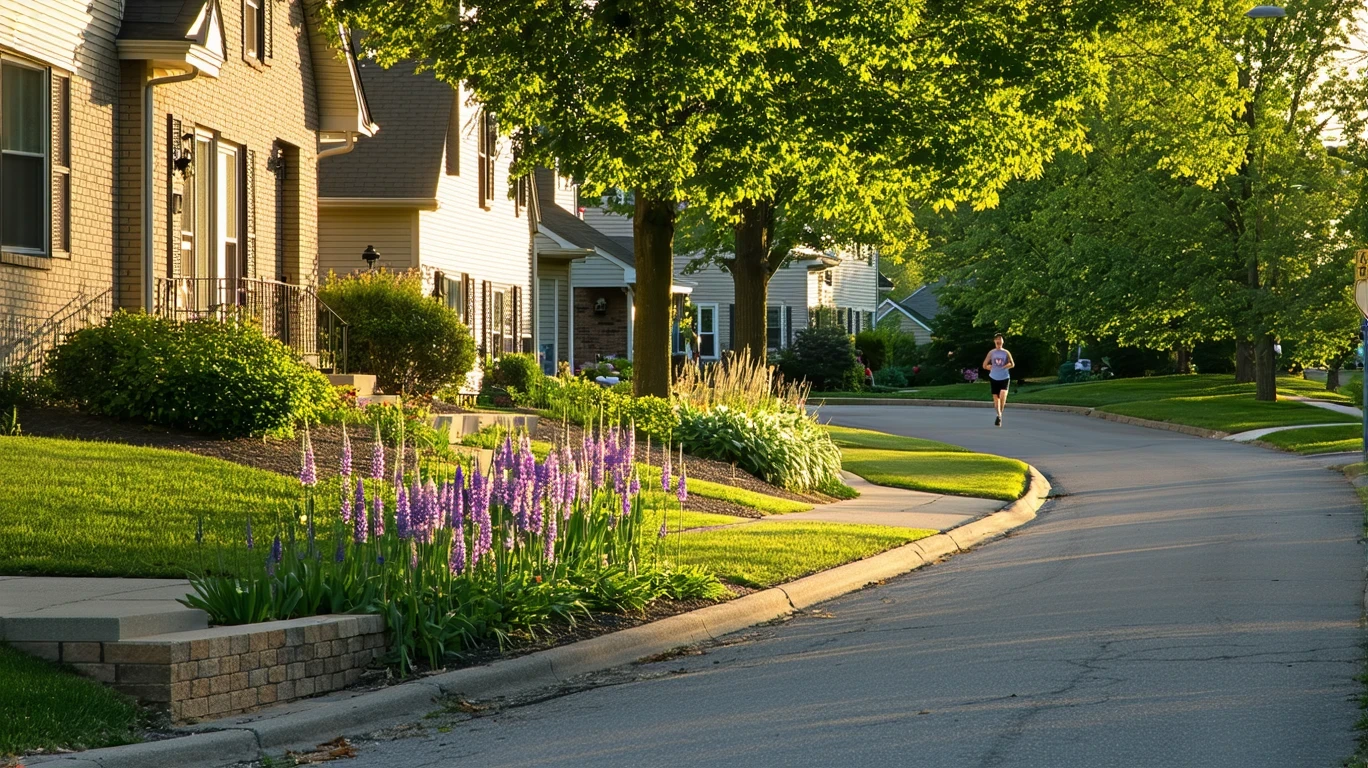
Overall Cost of Living Snapshot
Saint Paul sits at a regional price parity index of 100, meaning its overall cost structure aligns with the national baseline. That doesn’t mean costs are uniform—it means the city’s mix of housing, utilities, transportation, and daily expenses averages out to a middle position relative to other U.S. metros. What matters more than the index is how those costs distribute across categories and how much control households have over each one.
Housing dominates the cost structure, as it does in most cities, but Saint Paul’s housing pressure comes less from rent volatility and more from ownership entry barriers and long-term property tax exposure. Utilities introduce moderate seasonal swings—winters are cold, heating bills are real, and natural gas pricing at $11.17 per MCF translates to noticeable exposure during extended heating months. Electricity rates of 15.39¢/kWh sit near the national median, so cooling season doesn’t create the same budget stress seen in hotter climates.
Transportation costs vary widely depending on household structure. Saint Paul offers walkable pockets with substantial pedestrian infrastructure, rail transit service, and notable bike infrastructure throughout parts of the city. Errands accessibility is high—both food and grocery establishment density exceed thresholds, meaning daily tasks don’t require long drives for many residents. But the city isn’t uniformly transit-rich, and households that settle in less-connected areas or require regular regional commutes will face persistent vehicle costs. Gas prices of $4.02 per gallon make frequent driving expensive, and winter weather adds maintenance and reliability pressure.
The unemployment rate of 2.9% signals a tight labor market, which supports income stability but also reflects competitive housing demand. Jobs are available, but that same demand keeps ownership and rental markets from softening significantly.
Driver verdict: Housing entry cost and transportation structure dominate. Surprises come from the gap between low-car and high-car households, and from how much seasonal utility swings and property taxes add to ownership over time.
Housing Costs (Primary Driver)
Saint Paul’s housing market in 2026 is defined by ownership dynamics rather than rental churn. Without current rental benchmarks, the clearest signal comes from the ownership side: this is a city where buying a home represents both the largest upfront cost and the most durable long-term exposure. Property taxes, insurance, and maintenance accumulate over time, and those costs don’t stabilize the way a lease does—they grow with assessed value, weather events, and deferred upkeep.
Renting offers more flexibility and lower entry friction, but it also means less control over renewal increases and fewer options to offset costs through efficiency upgrades or equity capture. Renters in Saint Paul face the same seasonal utility exposure as owners, but without the ability to invest in insulation, windows, or HVAC improvements that reduce long-term bills.
The city’s mixed building height character and presence of both residential and commercial land use create neighborhood variety. Some areas offer dense, walkable blocks with older housing stock and lower car dependency; others lean suburban with single-family homes and longer distances to transit. Where you live determines not just your housing cost, but your transportation and time costs as well.
Saint Paul functions as a long-term ownership market with rental optionality. If you’re planning to stay and can manage the entry cost, ownership builds equity and control. If you’re transitional, testing the metro, or need flexibility, renting makes sense—but you’ll pay for that flexibility in less predictability and fewer efficiency levers.
| Housing Type | Cost Anchor | What That Buys You |
|---|---|---|
| Ownership | Entry cost + property tax + maintenance exposure | Equity capture, upgrade control, stable monthly principal, but rising taxes and repair risk |
| Renting | Lease rate + renewal risk | Flexibility, lower entry friction, no maintenance liability, but no equity and less control over increases |
Conclusion: Saint Paul is a buying city for households with stability and capital; a renting city for those who need flexibility or are still evaluating fit.
Utilities & Energy Risk
Electricity in Saint Paul costs 15.39¢ per kilowatt-hour, which sits near the national median. For a household using around 1,000 kWh per month—typical for a moderately sized home with standard appliances and seasonal air conditioning—that translates to roughly $154 per month in electricity costs before fees or taxes (illustrative context). Cooling season exists but isn’t extreme; summers are warm, not scorching, so AC doesn’t dominate the budget the way it does in the South or Southwest.
Natural gas is the bigger variable. Priced at $11.17 per thousand cubic feet (MCF), gas costs matter most during the long heating season. A household using around 100 therms per month during winter months (roughly equivalent to 1 MCF) would face a baseline gas cost of about $11 per month per MCF used—but actual usage scales with home size, insulation quality, and thermostat settings (illustrative context). Older homes with poor insulation or inefficient furnaces can see usage climb significantly, and cold snaps push bills higher. Gas exposure isn’t catastrophic, but it’s persistent and harder to control than electricity.
Water and sewer costs aren’t captured in the current data, but they’re typically billed separately and add another fixed layer to monthly utility totals. Trash and recycling may be bundled or billed independently depending on housing type and provider.
Risk classification: Moderate. Electricity is predictable and manageable. Natural gas introduces seasonal volatility that’s noticeable but not destabilizing for most households. The biggest risk is for renters in poorly insulated units who can’t upgrade efficiency and owners in older homes who defer weatherization work.
Groceries & Daily Costs
Grocery costs in Saint Paul track close to national baselines, with regional price parity at 100 indicating no significant markup or discount relative to the broader U.S. market. Derived estimates for common items include bread at $1.81 per pound, eggs at $2.35 per dozen, milk at $4.07 per half-gallon, chicken at $2.03 per pound, and ground beef at $6.70 per pound. These figures reflect national baselines adjusted for regional price conditions and are not observed local prices, but they provide useful context for understanding grocery budget pressure.
What matters more than individual item prices is the city’s errands accessibility. Saint Paul shows high density of both food establishments and grocery stores, meaning most residents don’t need to drive long distances or make special trips for daily shopping. That structural accessibility reduces the hidden costs of grocery shopping—time, fuel, and the need to batch errands—and makes it easier to shop frequently, compare prices, and avoid over-purchasing perishables.
For a household that prioritizes fresh ingredients and cooks most meals at home, grocery costs will be moderate but consistent. For households relying more on prepared foods, dining out, or convenience options, costs will climb faster—not because Saint Paul is expensive, but because convenience always costs more than planning.
The real grocery advantage here isn’t price—it’s access. The density of options and the ability to walk, bike, or take a short drive to multiple stores gives households more control over where and how they shop, which translates to better price discovery and less dependency on a single retailer.
Transportation Reality
Transportation costs in Saint Paul vary more than any other category, and the variation is structural, not seasonal. The city offers rail transit, notable bike infrastructure, and walkable pockets with high pedestrian-to-road ratios, which means some households can function with minimal or no car dependency. But the city isn’t uniformly connected, and households that live outside transit corridors, work in suburban office parks, or need to make regional trips will face persistent vehicle costs.
Gas prices of $4.02 per gallon make frequent driving expensive. A household commuting 25 miles round trip daily in a vehicle averaging 25 miles per gallon would use about 20 gallons per month, costing roughly $80 in fuel alone (illustrative context). Add insurance, maintenance, registration, and parking, and a single-car household easily carries $300 to $500 per month in transportation costs. Two-car households double that exposure.
The alternative exists but requires intentional housing placement. Residents near rail stops, in neighborhoods with high errands accessibility, or within biking distance of work can reduce or eliminate car dependency for daily tasks. Saint Paul’s integrated park density and water features also make walking and biking more pleasant and practical year-round, though winter weather introduces friction.
Commute norms aren’t captured in the current data, but the presence of rail transit and the city’s role as a regional hub suggest a mix of short in-city commutes and longer regional trips. Households that can align housing, work, and errands within a low-car radius will see the biggest transportation savings. Those who can’t—or who prioritize cheaper housing in less-connected areas—will carry higher transportation costs indefinitely.
Transportation is a recurring exposure, not a one-time cost. It doesn’t spike seasonally like utilities, but it compounds monthly, and it’s harder to reduce once your housing and work locations are set. In Saint Paul, finding a place that minimizes car dependency is one of the highest-leverage cost decisions a household can make.
Cost Exposure Profiles
Saint Paul’s cost structure creates distinct exposure profiles depending on how households navigate housing, transportation, and utilities. The city doesn’t punish or reward any single choice—it amplifies the consequences of mismatches between where you live, how you move, and what you prioritize.
Low-exposure households own homes in walkable pockets near rail or high errands density, bike or walk for daily tasks, use transit for longer trips, and live in well-insulated housing stock that limits heating costs. These households carry housing costs but minimize transportation and utility volatility. Their biggest risks are property tax increases and deferred maintenance, both of which are slow-moving and partially controllable.
High-exposure households rent in car-dependent areas far from transit, commute long distances by vehicle, live in older or poorly insulated units, and lack control over efficiency upgrades. These households face compounding costs: high transportation spending, volatile utility bills, and rental increases they can’t offset. Their flexibility is higher, but so is their recurring cost burden.
The difference isn’t income—it’s structure. A high-income household in a car-dependent, inefficient home can carry higher monthly costs than a moderate-income household in a transit-accessible, well-insulated unit. Saint Paul rewards alignment: housing placement that reduces transportation needs, ownership that enables efficiency investment, and neighborhood selection that matches household logistics to available infrastructure.
The city’s strong family infrastructure—both schools and playgrounds meet density thresholds—makes it viable for households with children, but those families also face higher transportation exposure if school, work, and activities aren’t clustered. Single adults and couples without kids have more flexibility to optimize for low-car living, especially if they can tolerate smaller or older housing in exchange for location.
Seasonal utility swings and property tax growth are the slow-burn exposures. They don’t dominate monthly cash flow the way rent or car payments do, but they accumulate, and they’re harder to escape once you’re locked into a housing decision. Renters face less tax risk but more rent risk; owners face less rent risk but more tax and maintenance risk. Neither is better—both require planning.
Frequently Asked Questions
Is Saint Paul more affordable than Minneapolis in 2026? Saint Paul and Minneapolis share a metro and similar cost structures, but Saint Paul tends to offer slightly lower housing entry costs in some neighborhoods and a different mix of walkable versus car-dependent areas. The difference is more about neighborhood character than overall affordability.
What does a typical cost profile look like in Saint Paul? A typical household carries moderate housing costs (ownership or rent), low to moderate grocery spending, and highly variable transportation costs depending on car dependency. Utilities introduce seasonal swings but aren’t extreme. The biggest cost differentiator is transportation structure, not income level.
Do utilities cost more in Saint Paul than in nearby areas? Electricity rates in Saint Paul are near the national median, and natural gas pricing is consistent with regional norms. Utility costs are driven more by home efficiency and heating season length than by rate differences between nearby cities.
What costs tend to surprise newcomers in Saint Paul? Newcomers often underestimate winter heating bills, property tax growth over time, and the cost gap between low-car and high-car living. The city’s walkable infrastructure and transit options aren’t immediately obvious, so households that settle in car-dependent areas without realizing it face higher long-term transportation costs.
Are property taxes higher in Saint Paul than in surrounding suburbs? Property tax rates and assessed values vary by jurisdiction, and some surrounding suburbs may offer lower effective tax rates. However, those suburbs often require higher transportation costs due to car dependency, which can offset the tax savings. The tradeoff depends on household priorities and commute patterns.
Can you live in Saint Paul without a car? Yes, but it requires intentional housing placement. Residents near rail stops, in neighborhoods with high errands accessibility, or within biking distance of work and daily needs can function with minimal or no car dependency. Households in less-connected areas will find car ownership necessary for most tasks.
How much do groceries cost compared to other Midwest cities? Saint Paul’s grocery costs align closely with national baselines and are comparable to other mid-sized Midwest metros. The bigger advantage is errands accessibility—high density of grocery and food options means less driving and more price competition, which gives households more control over spending.
Is Saint Paul a good value for families? Saint Paul offers strong family infrastructure, with both schools and playgrounds meeting density thresholds, and integrated park access throughout the city. Families benefit from the city’s walkable pockets and transit options, but they also face higher transportation exposure if work, school, and activities aren’t clustered. The value depends on how well housing location aligns with family logistics.
How this article was built: In addition to public economic data, this article incorporates location-based experiential signals derived from anonymized geographic patterns—such as access density, walkability, and land-use mix—to reflect how day-to-day living actually feels in Saint Paul, MN.
—