
Liberty is considered moderately priced in 2026, with a median home value of $250,200 and median rent of $1,004 per month. The value proposition depends on housing entry cost versus car dependence—walkable pockets exist, but daily errands remain corridor-clustered, making vehicle ownership a recurring exposure for most households.
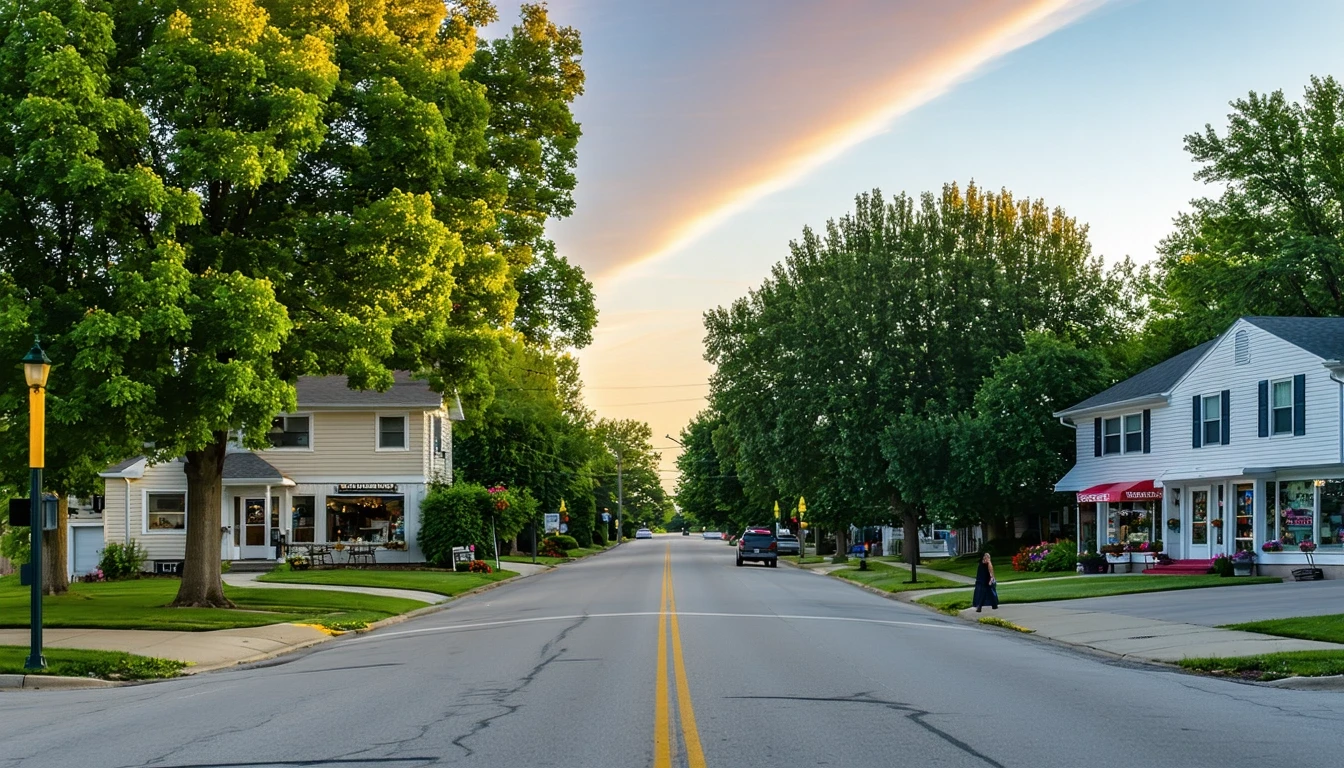
Overall Cost of Living Snapshot
You’re staring at a spreadsheet, trying to figure out if Liberty makes sense on your budget. The numbers look reasonable at first glance—housing costs sit below many metro benchmarks, and the regional price parity index of 87 suggests everyday purchases cost less here than the national baseline. But the real question isn’t whether Liberty is cheap or expensive in the abstract. It’s whether the cost structure fits the way you’ll actually live.
Liberty’s cost profile is shaped by two competing forces: accessible housing entry points and persistent car dependency. The median home value of $250,200 and median rent of $1,004 per month position Liberty as a moderately priced suburban option within the Kansas City metro. Grocery and daily costs track below national averages thanks to the lower regional price index, and unemployment sits at a tight 3.2%, signaling a stable local economy. But the city’s infrastructure tells a different story about mobility. Despite pockets of walkable neighborhoods with strong pedestrian-to-road ratios, food and grocery establishments cluster along corridors rather than distributing evenly. That pattern—combined with a 22-minute average commute and nearly one-third of workers facing long commutes—means most households here absorb transportation as a fixed, recurring cost layer.
The primary cost driver in Liberty is housing entry cost, whether you’re buying or renting. The secondary driver is transportation exposure—not because gas is unusually expensive at $3.83 per gallon, but because the city’s land-use mix and errands accessibility require most residents to own and operate at least one vehicle regularly. Surprises tend to come not from price spikes, but from underestimating how often you’ll drive and how that compounds over time when combined with insurance, maintenance, and depreciation.
Housing Costs (Primary Driver)
Housing dominates the cost equation in Liberty, but the pressure point shifts depending on whether you rent or buy. At $1,004 per month, the median gross rent offers a lower monthly outlay than ownership in many cases, but it comes with renewal risk and limited control over annual increases. Renters face predictable monthly costs in the short term but absorb volatility at lease renewal, especially in a tight market where unemployment is low and demand remains steady.
Ownership, by contrast, front-loads the financial commitment. A $250,200 median home value translates to a substantial down payment and closing costs, but it locks in principal and interest payments (assuming a fixed-rate mortgage) and shifts long-term risk from rent increases to property tax adjustments, insurance premiums, and maintenance cycles. Owners gain equity accumulation and cost predictability over time, but they also inherit responsibility for utilities, repairs, and the operational costs of a larger living footprint.
Liberty functions as a buying-oriented market for households with stable income and the ability to manage upfront costs. Renting remains viable for those prioritizing flexibility or avoiding maintenance risk, but the value proposition tilts toward ownership for anyone planning to stay longer than a few years. The housing stock reflects mixed building heights and a blend of residential and commercial land use, offering some variety in form and price, but the dominant pattern is single-family detached homes that assume car ownership and longer-term occupancy.
| Housing Type | Cost Anchor | What That Buys You |
|---|---|---|
| Median Home Value | $250,200 | Equity-building, fixed monthly housing cost (principal & interest), maintenance responsibility, property tax exposure |
| Median Gross Rent | $1,004/month | Lower upfront cost, flexibility, landlord-managed maintenance, renewal risk and rent volatility |
Utilities & Energy Risk
Utility costs in Liberty carry moderate risk, driven more by seasonal intensity than by rate structure. Electricity runs 12.17¢ per kWh, a baseline that sits near regional norms, while natural gas is priced at $14.24 per MCF (roughly equivalent to 100 therms). Neither rate is extreme, but Liberty’s climate—marked by hot, humid summers and cold winter stretches—means households face extended cooling and heating seasons that push usage well beyond minimal levels.
Summer cooling dominates warm-weather utility bills. Triple-digit heat days are not uncommon, and high humidity amplifies the load on air conditioning systems. Homes with older HVAC equipment, poor insulation, or west-facing exposure see the steepest increases during peak months. Winter heating, while less intense than in northern climates, still requires consistent natural gas or electric heat over several months, particularly during cold snaps.
The risk isn’t that rates will spike unpredictably—it’s that seasonal usage swings create budget volatility. A household that budgets based on spring or fall usage will undershoot summer and winter reality by a meaningful margin. Efficiency upgrades—programmable thermostats, attic insulation, weatherstripping—help reduce exposure, but they don’t eliminate the underlying seasonal pattern. Renters in older buildings or units with landlord-controlled systems have less control over this lever and absorb the volatility with fewer mitigation options.
Groceries & Daily Costs
Grocery costs in Liberty benefit from the region’s below-average price index (RPP of 87), which pulls everyday purchase prices below the national baseline. While specific item-level prices vary by store and season, the overall grocery pressure here is lighter than in higher-cost metros. Bread, dairy, eggs, and staple proteins cost less in absolute terms than they would in cities with RPP indices near or above 100.
That said, the structural reality of grocery shopping in Liberty adds friction that offsets some of the price advantage. Food and grocery establishments cluster along commercial corridors rather than distributing evenly across neighborhoods. Medium-density food and grocery access means most households drive to shop, and the convenience of walkable errands—common in denser urban cores—largely doesn’t exist here. The cost of groceries themselves may be lower, but the transportation cost of acquiring them is baked into the weekly routine.
For households accustomed to planning around a weekly shopping trip, this pattern is manageable. For those who value spontaneous errands, quick top-ups, or car-free grocery runs, Liberty’s layout introduces time and vehicle costs that compound over months. The price relief is real, but it doesn’t translate to a low-effort, low-logistics grocery experience.
Transportation Reality
Transportation in Liberty is not optional—it’s a recurring cost layer that most households cannot avoid. The average commute clocks in at 22 minutes, but that figure masks significant variation: 30.5% of workers face long commutes, and only 4.3% work from home. The city’s infrastructure includes some bike presence in pockets and walkable neighborhoods with strong pedestrian-to-road ratios, but daily errands remain corridor-clustered, and public transit options are minimal. The result is a car-dependent environment where vehicle ownership, fuel, insurance, and maintenance become fixed expenses rather than discretionary choices.
At $3.83 per gallon, gas prices in Liberty sit near regional norms—not a bargain, but not a crisis. The real exposure comes from frequency and distance. Commuters driving 25 miles round trip five days a week burn through fuel steadily, and that’s before accounting for errands, weekend trips, or multi-vehicle households. Fuel is just one piece: insurance premiums, oil changes, tire replacements, and depreciation all layer onto the base cost of owning a car. For households running two vehicles, transportation can rival or exceed housing as a monthly outflow.
Liberty’s layout rewards those with short commutes and punishes those with long ones. A 15-minute drive to work in a fuel-efficient vehicle keeps transportation manageable. A 45-minute commute in an older SUV turns transportation into a dominant budget line. The city offers limited alternatives—biking works in some pockets, but it’s not a viable primary mode for most—and the low work-from-home rate suggests most jobs here require physical presence. Transportation isn’t volatile the way utilities are, but it’s relentless, and underestimating it is one of the most common budget miscalculations newcomers make.
Cost Exposure Profiles
Liberty’s cost structure creates distinct exposure profiles depending on housing tenure, commute length, and vehicle count. These aren’t income tiers—they’re structural situations that determine which cost categories dominate and where financial pressure concentrates.
Low-exposure households in Liberty typically own their home (locking in housing costs), work close to home (minimizing transportation burn), and operate a single fuel-efficient vehicle. They benefit from the city’s moderate housing entry cost and below-average grocery prices, and they avoid the compounding effect of long commutes and multi-car ownership. Utility seasonality still creates swings, but those swings are predictable and can be managed with efficiency measures and budget smoothing.
High-exposure households face a different reality. Renters absorb renewal risk and have less control over housing cost growth. Long commuters—especially those driving 30+ minutes each way—turn transportation into a major recurring expense, compounded if the household runs two or more vehicles. Families with school-age children face additional friction: school and playground density in Liberty sits below thresholds, meaning extracurriculars, playdates, and school runs often require driving. Healthcare access is limited to routine local clinics (no hospital in-city), so serious medical needs mean travel to nearby facilities, adding another transportation layer.
The dividing line isn’t income—it’s how many cost layers you carry simultaneously. A renter with a long commute and two cars faces compounding pressure across housing volatility, transportation frequency, and vehicle operating costs. An owner with a short commute and one vehicle isolates exposure to housing maintenance and seasonal utilities, both of which are more controllable. Liberty rewards those who can minimize transportation dependence and lock in housing costs early. It penalizes those who can’t.
Frequently Asked Questions
Is Liberty more affordable than Kansas City in 2026? Liberty’s median home value of $250,200 and median rent of $1,004 per month generally sit below Kansas City’s urban core pricing, but the tradeoff is increased car dependency. You’ll likely spend less on housing and groceries, but more on transportation and commute time.
What does a typical cost profile look like in Liberty? Most households here prioritize housing and transportation as the two dominant cost categories. Utilities add moderate seasonal swings, and groceries benefit from below-average regional pricing. The profile skews toward fixed, recurring expenses rather than volatile day-to-day costs.
Do utilities cost more in Liberty than in nearby suburbs? Utility rates in Liberty—12.17¢/kWh for electricity and $14.24/MCF for natural gas—track close to regional averages. The bigger variable is seasonal usage intensity, which depends more on home efficiency and climate exposure than on rate differences between nearby cities.
What costs tend to surprise newcomers in Liberty? Transportation is the most commonly underestimated expense. The city’s corridor-clustered errands and limited transit options mean most households drive frequently, and the cumulative cost of fuel, insurance, and maintenance adds up faster than many expect, especially for multi-vehicle households.
Are property taxes higher in Liberty than in Independence or Blue Springs? Property tax rates vary by jurisdiction and assessment practices. Liberty’s tax structure is set locally, and direct comparisons require looking at effective rates and assessed values for similar properties. It’s worth confirming current mill levies and exemptions before assuming parity with nearby cities.
Is Liberty a good fit for renters or buyers? Liberty tilts toward buyers. The $250,200 median home value offers a manageable entry point for ownership, and locking in housing costs makes sense for those planning to stay. Renters gain flexibility but face renewal risk and less control over long-term cost growth.
How does Liberty’s walkability affect daily costs? Despite pockets of strong pedestrian infrastructure, daily errands in Liberty remain corridor-clustered, meaning most households still rely on cars for groceries, appointments, and errands. Walkability exists in specific neighborhoods, but it doesn’t eliminate the need for vehicle ownership across the city as a whole.
How this article was built: In addition to public economic data, this article incorporates location-based experiential signals derived from anonymized geographic patterns—such as access density, walkability, and land-use mix—to reflect how day-to-day living actually feels in Liberty, MO.
—