
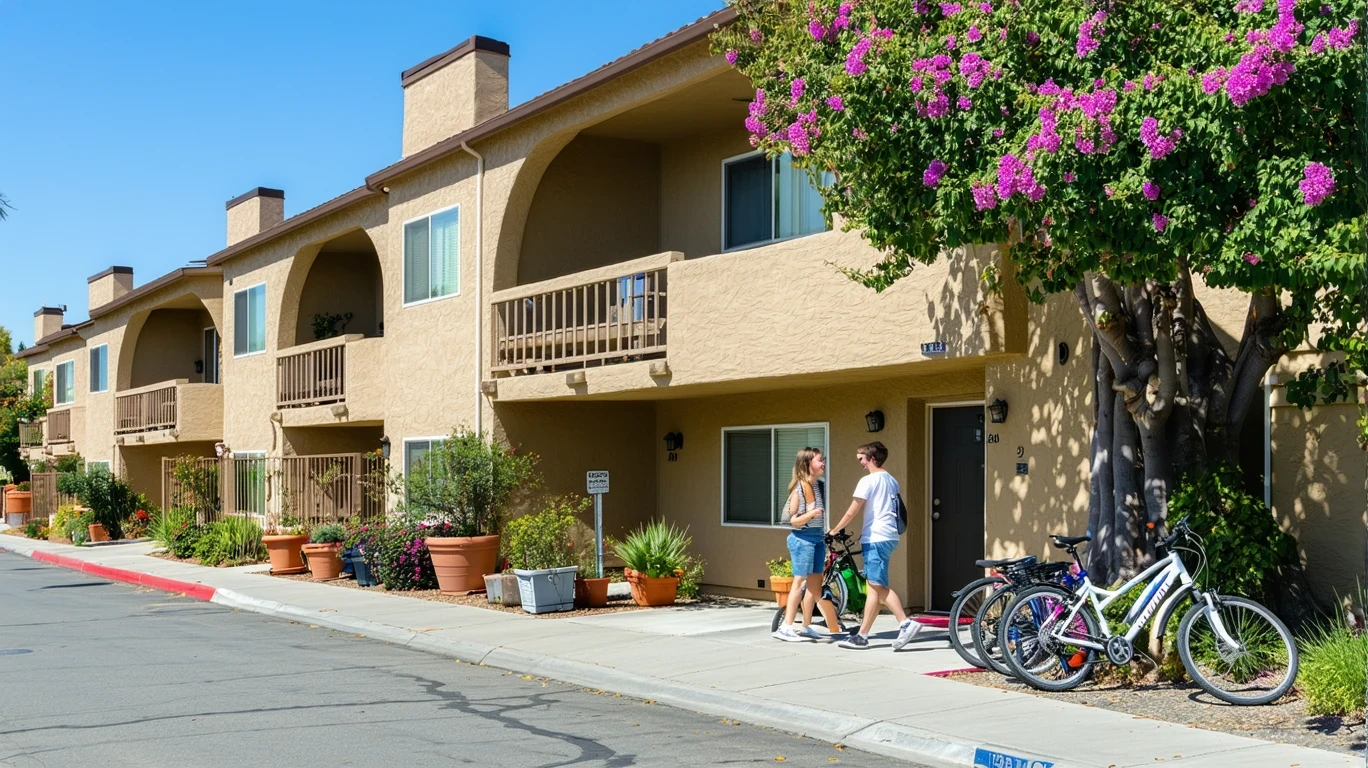
Norco and Ontario sit just miles apart in California’s Inland Empire, sharing the same regional economy, similar weather patterns, and proximity to major employment corridors. Yet the two cities attract different households for different reasons. Norco offers more space, a quieter residential character, and abundant outdoor access. Ontario provides stronger transit connections, denser daily amenities, and more diverse housing options. In 2026, the decision between them isn’t about which city costs less overall—it’s about which cost pressures show up where, and which household types feel those differences most acutely.
Both cities face the same regional challenges: elevated energy costs, car-dependent commuting patterns, and California’s high baseline cost structure. But the cost structure diverges in meaningful ways. Norco’s housing market skews toward higher entry costs and larger single-family homes, while Ontario offers more rental inventory, apartment options, and access to rail transit. Daily errands feel different in each city—Ontario’s food and grocery density exceeds high thresholds, while Norco’s remains sparse, requiring more intentional trip planning. For families, Ontario provides both schools and playgrounds at density thresholds that Norco doesn’t quite meet. For healthcare, Ontario offers local clinics, while Norco lacks hospital or clinic presence within city limits.
This comparison explains where cost pressure concentrates differently, how the same income feels in each city, and which households gain the most control by choosing one over the other. It’s not about declaring a winner—it’s about understanding which tradeoffs matter for your household in 2026.
Housing Costs
Housing dominates the cost experience in both cities, but the pressure shows up differently. Norco’s median home value sits at $683,200, while Ontario’s is $513,000. That gap reflects more than price—it signals differences in housing stock, lot sizes, and the types of buyers each market attracts. Norco’s housing inventory leans heavily toward single-family homes on larger parcels, often with equestrian zoning and rural character. Ontario’s housing mix includes more apartments, townhomes, and smaller single-family lots, creating more entry points for first-time buyers and renters.
For renters, the difference is narrower but still meaningful. Norco’s median gross rent is $1,884 per month, compared to Ontario’s $1,826. Both figures reflect the Inland Empire’s broader rental pressure, but the availability of rental inventory differs. Ontario’s apartment density and mixed-use development create more rental options across price tiers, while Norco’s rental stock skews toward single-family homes, which tend to command higher rents for the space provided. Renters prioritizing walkable access to errands or transit will find Ontario’s rental market more aligned with those needs, while those seeking yard space and quiet streets may accept Norco’s slightly higher rent as a tradeoff for lifestyle fit.
For buyers, the entry barrier in Norco is steeper. The higher median home value reflects not just price appreciation but also the cost of land, larger lot sizes, and the premium buyers pay for Norco’s distinctive character. Ontario’s lower median home value opens the door to homeownership for households with moderate incomes, particularly when combined with Ontario’s stronger family infrastructure and transit access. However, buyers in Ontario may face more competition for well-maintained properties in desirable neighborhoods, while Norco’s market moves more slowly, offering less urgency but fewer alternatives.
Housing takeaway: Norco imposes a higher entry barrier for both renters and buyers, favoring households with higher incomes who prioritize space, privacy, and outdoor access. Ontario’s housing market offers more flexibility, more rental inventory, and lower entry costs, making it more accessible to moderate-income households, first-time buyers, and renters who value proximity to daily amenities and transit. The difference isn’t about total cost—it’s about what type of housing pressure dominates your decision.
Utilities and Energy Costs
Energy costs in both cities reflect California’s elevated baseline, but the exposure differs based on housing type, home size, and cooling intensity. Norco’s electricity rate is 33.22¢/kWh, slightly lower than Ontario’s 34.71¢/kWh. Natural gas pricing follows a similar pattern: Norco pays $22.96/MCF, while Ontario pays $23.78/MCF. These differences are small in isolation, but they compound over time when combined with housing size and seasonal demand.
Norco’s housing stock—predominantly larger single-family homes—creates higher baseline energy usage. Cooling a 2,000+ square-foot home through Inland Empire summers drives electricity consumption well above what a smaller apartment or townhome requires. Households in Norco face longer cooling seasons, higher peak usage, and less ability to offset costs through shared walls or smaller footprints. Older homes in Norco may lack modern insulation or efficient HVAC systems, further increasing exposure to summer rate spikes. Utility bills in Norco are less predictable month-to-month, with sharp seasonal swings that require careful budgeting.
Ontario’s mixed housing stock—apartments, townhomes, and smaller single-family homes—offers more variability in energy exposure. Apartment dwellers benefit from shared walls, smaller square footage, and lower baseline usage, making utility costs more predictable and easier to control. Single-family homeowners in Ontario still face elevated cooling costs, but the smaller average home size reduces the magnitude of seasonal spikes. Ontario’s slightly higher electricity rate matters less when total usage is lower. Households in newer construction or multi-family buildings experience the least volatility, while those in older single-family homes face exposure similar to Norco’s.
Utility takeaway: Norco’s larger housing stock and single-family dominance create higher energy exposure and more volatility, particularly for households in older homes or those sensitive to seasonal bill swings. Ontario’s mixed housing inventory offers more control, with apartment and townhome dwellers experiencing lower baseline usage and more predictable costs. The difference isn’t about rates—it’s about how housing type and home size amplify or dampen energy exposure.
Groceries and Daily Expenses
Grocery and daily spending pressure differs not because of price variation—both cities share the same regional price parity—but because of access density and the friction costs of running errands. Ontario’s food and grocery density exceeds high thresholds, meaning residents encounter supermarkets, discount grocers, and prepared food options within short distances of most neighborhoods. Norco’s food density sits in the medium band, while grocery density falls below low thresholds, requiring more intentional trip planning and longer drives to stock up.
For households managing larger grocery volumes—families with kids, multi-person households, or those cooking most meals at home—Ontario’s density advantage reduces time costs and enables more flexible shopping patterns. Residents can comparison-shop across multiple stores, take advantage of weekly sales, or make quick trips for missing ingredients without adding significant drive time. Norco’s sparser grocery landscape pushes households toward bulk shopping, fewer trips, and less flexibility to respond to price differences between stores. The time cost of grocery runs in Norco adds friction that doesn’t show up in receipts but affects how households plan their weeks.
Prepared food and convenience spending follow similar patterns. Ontario’s higher food establishment density creates more temptation for takeout, coffee runs, and quick meals, which can quietly inflate monthly spending for households without strong budgeting discipline. Norco’s lower density reduces convenience spending opportunities, but it also limits access to affordable prepared food options when time is tight. Single adults and dual-income couples in Ontario may find themselves spending more on convenience without realizing it, while similar households in Norco face fewer options but also fewer spending triggers.
Grocery takeaway: Ontario’s high grocery and food density reduces friction, saves time, and enables more flexible shopping strategies, but it also creates more opportunities for convenience spending creep. Norco’s sparse grocery access requires more planning, longer trips, and bulk shopping discipline, which can reduce impulse spending but increases time costs. Families and larger households benefit more from Ontario’s density, while smaller households in Norco may find the quieter retail landscape easier to navigate without overspending.
Taxes and Fees
Both cities operate under California’s state tax structure, meaning sales tax, income tax, and vehicle registration costs remain consistent across the region. The differences emerge in property taxes, local fees, and the prevalence of homeowner association (HOA) obligations. Property taxes in both cities reflect assessed home values, meaning Norco’s higher median home value translates to higher annual property tax bills for homeowners, even though the rate structure is similar. Ontario’s lower home values reduce the absolute property tax burden, creating more breathing room for households managing ongoing ownership costs.
HOA fees vary widely in both cities, but Norco’s prevalence of planned communities and equestrian-zoned neighborhoods often comes with mandatory HOA participation. These fees can range from modest amounts covering basic landscaping to more substantial monthly obligations that bundle amenities like trail maintenance, community centers, or shared facilities. Ontario’s housing mix includes more non-HOA single-family homes and older neighborhoods without mandatory fees, giving buyers more options to avoid recurring obligations. For households sensitive to predictable monthly costs, Ontario’s housing stock offers more flexibility to minimize fee exposure.
Local service fees—trash collection, water, sewer—operate similarly in both cities, though the structure varies by provider and housing type. Single-family homeowners in both cities typically pay these fees separately, while apartment renters may see them bundled into rent. Norco’s larger lot sizes can sometimes result in higher water bills for households maintaining landscaping or outdoor features, while Ontario’s denser housing stock and smaller yards reduce baseline water usage. Neither city imposes unusual local taxes or assessments, but the cumulative effect of property taxes, HOA fees, and service costs adds more ongoing pressure in Norco due to higher home values and larger properties.
Taxes and fees takeaway: Norco’s higher home values and prevalence of HOA-governed communities create more ongoing cost pressure for homeowners, particularly those managing property taxes and mandatory fees simultaneously. Ontario’s lower home values and more diverse housing stock reduce baseline property tax exposure and offer more non-HOA options, making ongoing ownership costs more predictable and easier to control. Renters in both cities face similar fee structures, but homeowners feel the difference more acutely.
Transportation and Commute Reality
Both cities depend heavily on cars for daily mobility, but transit access and commute friction differ meaningfully. Norco offers bus service, but no rail transit, meaning residents commuting to employment centers in Riverside, Corona, or Los Angeles rely almost entirely on personal vehicles. Ontario provides both bus service and rail transit, with Metrolink stations offering direct connections to downtown Los Angeles, Riverside, and other regional hubs. For households with one or more commuters, Ontario’s rail access reduces time costs, fuel exposure, and the stress of daily freeway driving.
Gas prices in 2026 sit at $5.98/gal in Norco and $5.51/gal in Ontario. The difference reflects local market conditions and proximity to distribution infrastructure, but the real cost divergence comes from commute distance and transit viability. Households in Norco face longer average drives to reach grocery stores, medical facilities, and employment centers, compounding fuel costs over time. Ontario’s denser layout and transit options reduce the need for every errand to require a car, particularly for households living near rail stations or commercial corridors.
Walkability and bike infrastructure exist in pockets in both cities, with pedestrian-to-road ratios exceeding high thresholds in certain neighborhoods. However, the day-to-day experience differs. Ontario’s mixed-use development and higher food establishment density create more opportunities to walk or bike for errands, while Norco’s sparser retail landscape and larger lot sizes make most trips car-dependent by default. Families with multiple drivers face higher insurance costs, maintenance exposure, and fuel volatility in Norco, while similar households in Ontario can sometimes reduce car dependency by leveraging transit for commutes and concentrating errands in walkable zones.
Transportation takeaway: Norco’s lack of rail transit and sparser daily amenities create higher car dependency, longer average trips, and more fuel exposure, particularly for multi-driver households or those commuting to distant employment centers. Ontario’s rail access, denser errands layout, and slightly lower gas prices reduce transportation friction and offer more flexibility to substitute transit for driving. The difference isn’t about total commute costs—it’s about control, predictability, and the ability to reduce car dependency when it makes sense.
Cost Structure Comparison
Housing pressure dominates the cost experience in both cities, but the nature of that pressure differs. Norco imposes a higher entry barrier, with elevated home values and rents that favor households with higher incomes and the ability to absorb front-loaded costs. Ontario’s lower housing entry costs and more diverse inventory create more access points for moderate-income households, first-time buyers, and renters who prioritize flexibility over space. For households sensitive to upfront costs or those stretching to qualify for a mortgage, Ontario’s housing market offers more breathing room.
Utilities introduce more volatility in Norco, where larger single-family homes and longer cooling seasons create higher baseline usage and sharper seasonal swings. Ontario’s mixed housing stock—particularly apartments and townhomes—offers more predictable energy costs and lower exposure to rate spikes. Households managing tight monthly budgets or those in older homes feel this difference more acutely, while those in newer construction or smaller units experience less variability in both cities.
Daily errands and grocery access matter more in Ontario, where high food and grocery density reduces time costs and enables more flexible shopping strategies. Norco’s sparse grocery landscape requires more planning, longer trips, and bulk shopping discipline, which can reduce convenience spending but increases time costs. Families managing larger grocery volumes or those juggling tight schedules benefit more from Ontario’s density, while smaller households in Norco may find the quieter retail landscape easier to navigate without overspending.
Transportation patterns create different friction costs in each city. Norco’s lack of rail transit and sparser daily amenities push households toward higher car dependency, longer average trips, and more fuel exposure. Ontario’s rail access and denser layout reduce the need for every trip to require a car, offering more control over transportation costs and time budgets. For households with multiple commuters or those sensitive to fuel volatility, Ontario’s transit infrastructure provides meaningful relief.
The better choice depends on which costs dominate your household. Households with higher incomes who prioritize space, outdoor access, and quiet residential character may find Norco’s higher housing costs worth the tradeoff, particularly if they can absorb utility volatility and car dependency without strain. Households with moderate incomes who prioritize transit access, daily errands convenience, and family infrastructure may find Ontario’s lower entry costs and denser amenities a better fit, even if it means less space or more competition for housing. The decision isn’t about which city costs less—it’s about which cost structure aligns with your household’s priorities, income stability, and tolerance for friction.
How the Same Income Feels in Norco vs Ontario
Single Adult
Housing becomes the non-negotiable first, but the entry point differs. In Norco, finding an affordable rental means accepting a single-family home with more space than needed or commuting from outside city limits. In Ontario, apartment options and denser rental inventory create more flexibility to match rent to income without overbuying space. Grocery trips in Norco require more planning and longer drives, while Ontario’s density allows quick stops without adding time costs. Car dependency dominates both cities, but Ontario’s rail access offers an escape valve for commuters willing to adjust schedules.
Dual-Income Couple
Housing costs consume a larger share of gross income in Norco, even with two earners, because the entry point skews higher and rental options favor single-family homes. Ontario’s lower median rent and more diverse housing stock create more room to save or absorb other costs. Utility bills in Norco swing more sharply with the seasons, requiring tighter budgeting during summer months, while Ontario’s mixed housing stock offers more predictable energy costs for couples in apartments or townhomes. Transportation pressure mounts faster in Norco if both partners commute, while Ontario’s rail access reduces fuel exposure and time costs for at least one earner.
Family with Kids
Housing space becomes essential, but the cost structure differs. Norco’s larger homes and outdoor access come with higher entry costs, steeper property taxes, and more utility volatility, leaving less flexibility for other expenses. Ontario’s lower home values and stronger family infrastructure—schools and playgrounds meeting density thresholds—reduce baseline housing pressure and create more breathing room for groceries, childcare, and activities. Daily errands in Ontario take less time and require fewer long trips, while Norco’s sparse grocery access adds friction to an already tight schedule. Healthcare access matters more with kids, and Ontario’s local clinics reduce the need to drive to neighboring cities for routine care.
Decision Matrix: Which City Fits Which Household?
| Decision factor | If you’re sensitive to this… | Norco tends to fit when… | Ontario tends to fit when… |
|---|---|---|---|
| Housing entry + space needs | You’re balancing upfront costs against long-term space and outdoor access | You have higher income, prioritize larger lots and quiet streets, and can absorb elevated entry costs | You need lower entry costs, more rental options, and flexibility to match housing to income without overbuying space |
| Transportation dependence + commute friction | You’re managing fuel costs, commute time, and the ability to reduce car dependency | You accept full car dependency, can absorb higher fuel exposure, and prioritize residential quiet over transit access | You value rail transit for commutes, want to reduce fuel volatility, and benefit from denser errands layout |
| Utility variability + home size exposure | You’re managing seasonal bill swings and baseline energy usage | You can absorb utility volatility, prefer larger homes, and prioritize space over predictable energy costs | You want more predictable utility bills, benefit from smaller footprints or shared walls, and prioritize budget stability |
| Grocery strategy + convenience spending creep | You’re balancing time costs, shopping flexibility, and impulse spending discipline | You prefer bulk shopping, can plan trips in advance, and value quieter retail landscapes with fewer spending triggers | You benefit from high grocery density, want flexible shopping options, and can manage convenience spending without overspending |
| Fees + friction costs (HOA, services, upkeep) | You’re managing ongoing obligations, property taxes, and mandatory fees | You accept higher property taxes and potential HOA fees in exchange for space, outdoor access, and community amenities | You want more non-HOA housing options, lower property tax exposure, and fewer mandatory recurring fees |
| Time budget (schedule flexibility, errands, logistics) | You’re managing household logistics, errands efficiency, and daily friction | You have schedule flexibility, can absorb longer errand trips, and prioritize residential character over convenience | You need denser amenities, shorter errand trips, and stronger family infrastructure to reduce daily logistics friction |
Lifestyle Fit
Norco and Ontario offer distinct lifestyle experiences despite their proximity. Norco’s identity revolves around equestrian culture, rural character, and outdoor access. The city’s park density exceeds high thresholds, with water features and open space integrated throughout. Residents prioritize privacy, larger lots, and quiet streets, accepting the tradeoff of sparser daily amenities and longer drives for errands. The pedestrian-to-road ratio exceeds high thresholds in certain neighborhoods, but the overall layout remains car-oriented, with most trips requiring a vehicle. Families drawn to Norco value space, outdoor recreation, and a slower pace, even if it means driving farther for groceries, healthcare, or entertainment.
Ontario’s lifestyle centers on accessibility, transit connectivity, and denser daily amenities. The city’s rail transit access provides direct connections to regional employment centers, reducing commute friction for households willing to adjust schedules. Food and grocery density exceeds high thresholds, creating more opportunities for quick errands, comparison shopping, and spontaneous dining. Ontario’s family infrastructure—both schools and playgrounds meeting density thresholds—supports households with kids more robustly than Norco’s. The urban form mixes low-rise and medium-height buildings, with both residential and commercial land use detected throughout, creating more walkable pockets and less reliance on cars for every trip. Residents prioritize convenience, transit access, and proximity to daily needs, accepting smaller lot sizes and denser surroundings as tradeoffs.
Both cities share the Inland Empire’s warm, dry climate, with extended cooling seasons and rare freezing nights. Outdoor recreation remains accessible in both cities, with integrated park access and water features present. However, the texture of daily life differs. Norco’s sparser grocery access and lack of rail transit create more friction for households managing tight schedules or multiple errands, while Ontario’s denser layout and transit options reduce time costs and offer more flexibility. Healthcare access diverges meaningfully—Ontario provides local clinics and pharmacies, while Norco lacks hospital or clinic presence within city limits, requiring residents to drive to neighboring cities for routine care. For families with young kids or households managing chronic health needs, Ontario’s healthcare infrastructure reduces friction and time costs.
Norco’s park density exceeds high thresholds, with water features and open space integrated throughout the city. Ontario offers rail transit access via Metrolink, with direct connections to downtown Los Angeles, Riverside, and other regional hubs.
Frequently Asked Questions
Is Norco or Ontario cheaper for renters in 2026? Norco’s median gross rent is $1,884 per month, compared to Ontario’s $1,826. The difference is narrow, but Ontario offers more rental inventory, particularly apartments and townhomes, creating more flexibility to match rent to income. Norco’s rental stock skews toward single-family homes, which command higher rents for the space provided. Renters prioritizing walkable access to errands or transit will find Ontario’s rental market more aligned with those needs, while those seeking yard space and quiet streets may accept Norco’s slightly higher rent as a tradeoff.
Which city is better for families with kids in 2026? Ontario provides stronger family infrastructure, with both schools and playgrounds meeting density thresholds, while Norco’s school density sits in the medium band without playground density support. Ontario’s high grocery density, local clinics, and rail transit reduce daily logistics friction, making it easier to manage errands, appointments, and commutes. Norco offers more outdoor access, larger homes, and quieter streets, but families must accept sparser amenities, longer errand trips, and the need to drive to neighboring cities for healthcare. The better choice depends on whether your household prioritizes space and outdoor access or convenience and infrastructure density.
How do utility costs differ between Norco and Ontario in 2026? Norco’s electricity rate is 33.22¢/kWh, slightly lower than Ontario’s 34.71¢/kWh, but the real difference comes from housing size and seasonal demand. Norco’s larger single-family homes create higher baseline energy usage and sharper seasonal swings, while Ontario’s mixed housing stock—particularly apartments and townhomes—offers more predictable costs and lower exposure to rate spikes. Households in older homes or those sensitive to seasonal bill volatility will feel the difference more acutely in Norco, while those in newer construction or smaller units experience less variability in both cities.
Does Ontario’s rail transit make a meaningful difference in 2026? For households with one or more commuters traveling to Los Angeles, Riverside, or other regional employment centers, Ontario’s Metrolink access reduces fuel exposure, time costs, and the stress of daily freeway driving. Norco lacks rail transit, meaning residents rely almost entirely on personal vehicles for commutes and errands. The difference compounds over time, particularly for multi-driver households or those sensitive to fuel volatility. Ontario’s rail access doesn’t eliminate car dependency, but it offers an escape valve that Norco simply doesn’t provide.
Which city offers better grocery access in 2026? Ontario’s food and grocery density exceeds high thresholds, meaning residents encounter supermarkets, discount grocers, and prepared food options within short distances of most neighborhoods. Norco’s grocery density falls below low thresholds, requiring more intentional trip planning and longer drives to stock up. For households managing larger grocery volumes or those juggling tight schedules, Ontario’s density reduces time costs and enables more flexible shopping strategies. Norco’s sparser grocery landscape requires more planning and bulk shopping discipline, which can reduce impulse spending but increases time costs.
Conclusion
Norco and Ontario offer different cost structures, different lifestyle textures, and different tradeoffs. Norco imposes higher housing entry costs, more utility volatility, and sparser daily amenities, but it delivers more space, outdoor access, and residential quiet. Ontario provides lower housing entry costs, stronger transit access, denser grocery and family infrastructure, and more predictable utility exposure, but it requires accepting smaller lot sizes and denser surroundings. Neither city is universally cheaper—the better choice depends on which costs dominate your household, which friction points you can absorb, and which lifestyle priorities matter most in 2026.
Households with higher incomes who prioritize space, outdoor recreation, and quiet streets may find Norco’s elevated housing costs and car dependency worth the tradeoff. Households with moderate incomes who prioritize transit access, daily errands convenience, and family infrastructure may find Ontario’s lower entry costs and denser amenities a better fit. The decision isn’t about total cost—it’s about understanding where cost pressure shows up, how it interacts with your household’s income and priorities, and which city gives you the most control over the costs that matter most.
How this article was built: In addition to public economic data, this article incorporates location-based experiential signals derived from anonymized geographic patterns—such as access density, walkability, and land-use mix—to reflect how day-to-day living actually feels in Norco and Ontario.