Is Oceanside expensive to live in? Oceanside is considered expensive in 2026, with a median home value of $644,600 and median rent of $2,078 per month. The value proposition depends heavily on housing entry cost versus transportation flexibility—rail transit and walkable pockets exist, but car ownership still dominates for most households.
Overall Cost of Living Snapshot
Oceanside operates at a regional price parity index of 179, meaning the overall cost structure runs roughly 79% above the national baseline. That premium shows up most visibly in housing, but it also extends into groceries, fuel, and utilities. This isn’t a city where one category stays cheap while another runs high—pressure is distributed across the board, with housing claiming the largest share of household budgets.
The primary cost driver is housing, whether renting or buying. The secondary driver is transportation, shaped by a 29-minute average commute, gas at $5.88 per gallon, and a built environment that mixes car dependence with emerging alternatives. Only 11.4% of workers operate from home, and 44.6% face long commutes, meaning most households are managing both high housing costs and recurring vehicle expenses.
Compared to inland Southern California cities, Oceanside sits in the middle tier—less expensive than coastal San Diego proper, but notably more expensive than Riverside or San Bernardino. The city’s coastal proximity and access to rail transit add value, but they don’t eliminate the financial pressure that defines the broader region.
Driver verdict: Housing dominates, transportation amplifies, and utilities add seasonal volatility. Surprises come from the cumulative weight of above-average costs in nearly every category, not from any single outlier.
Housing Costs (Primary Driver)
At a median home value of $644,600, ownership in Oceanside requires substantial upfront capital and long-term financial commitment. Median gross rent sits at $2,078 per month, positioning rental housing as expensive but more accessible than buying for households without significant savings or dual incomes.
The renting-versus-owning decision hinges on time horizon and income stability. Renting offers flexibility and lower entry cost, but it exposes households to lease renewals and limited control over housing expenses over time. Ownership locks in principal and interest (assuming a fixed-rate mortgage), but it introduces property tax, insurance, maintenance, and HOA fees where applicable—all of which tend to rise.
Oceanside functions as a mixed-tenure city. Renting makes sense for newcomers, short-term residents, and households prioritizing liquidity. Buying makes sense for those planning to stay long enough to justify transaction costs and who can manage the financing and ongoing expenses. Neither path is clearly “better”—each comes with a distinct risk profile.
| Housing Type | Cost Anchor | What That Buys You |
|---|---|---|
| Median Home | $644,600 | Ownership equity, fixed financing, long-term cost control, maintenance responsibility |
| Median Rental | $2,078/month | Flexibility, lower entry cost, exposure to lease renewals, limited control over increases |
Conclusion: Oceanside is a high-cost housing market where both renting and owning require significant income. The choice between them is structural, not financial—renters trade long-term control for flexibility; buyers trade liquidity for stability.
Utilities & Energy Risk
Electricity in Oceanside costs 30.29¢ per kWh, among the highest rates in the country. For a household using around 1,000 kWh per month—typical for moderate air conditioning and standard appliances—that translates to roughly $303 per month in electricity costs alone, before fees or tiered pricing. Coastal proximity moderates cooling demand compared to inland areas, but the rate itself is the dominant factor.
Natural gas is priced at $22.96 per MCF (approximately 100 therms). Gas usage in Oceanside is generally low year-round due to mild winters, but households with gas heating, water heating, or cooking will see this cost layer in during cooler months. The risk here is less about volume and more about rate volatility—natural gas prices can swing significantly based on regional supply and policy.
Utility costs in Oceanside are not a minor line item. High electricity rates mean that even modest usage generates substantial monthly bills, and any increase in cooling demand—whether from heat events or household size—amplifies exposure quickly. Efficiency upgrades, behavioral adjustments, and time-of-use rate management can reduce usage, but they don’t eliminate the underlying rate pressure.
Risk classification: major. Utilities represent a recurring, non-negotiable expense that rises with household size, occupancy hours, and climate stress. The combination of high rates and limited alternatives makes this a significant cost factor for all household types.
Groceries & Daily Costs
Grocery costs in Oceanside reflect the broader regional price environment. Ground beef runs $11.99 per pound, milk costs $7.28 per half-gallon, and eggs are priced at $4.20 per dozen. These are derived estimates based on national baselines adjusted by regional price parity—not observed local prices—but they illustrate the elevated cost structure that shapes daily shopping.
For households cooking at home regularly, grocery spending becomes a meaningful recurring expense. The pressure isn’t catastrophic, but it’s persistent. Families with children, households preparing multiple meals daily, or anyone managing dietary restrictions will feel the difference compared to lower-cost regions. Stores such as Walmart, Costco, and regional chains offer some price variation, but the baseline remains high across the board.
Food and grocery establishments in Oceanside are corridor-clustered, meaning access is concentrated along certain routes rather than evenly distributed. This pattern means some households can walk or bike to groceries, while others will need to drive, adding time and transportation cost to the errand itself. The accessibility gap isn’t extreme, but it’s real—proximity matters, and not everyone has it.
Transportation Reality
The average commute in Oceanside is 29 minutes, with 44.6% of workers facing long commutes. Only 11.4% work from home, meaning the vast majority of employed residents are moving regularly—and most are doing it by car. Gas costs $5.88 per gallon, among the highest in the nation, and that price applies to every trip: commuting, errands, school runs, and weekend travel.
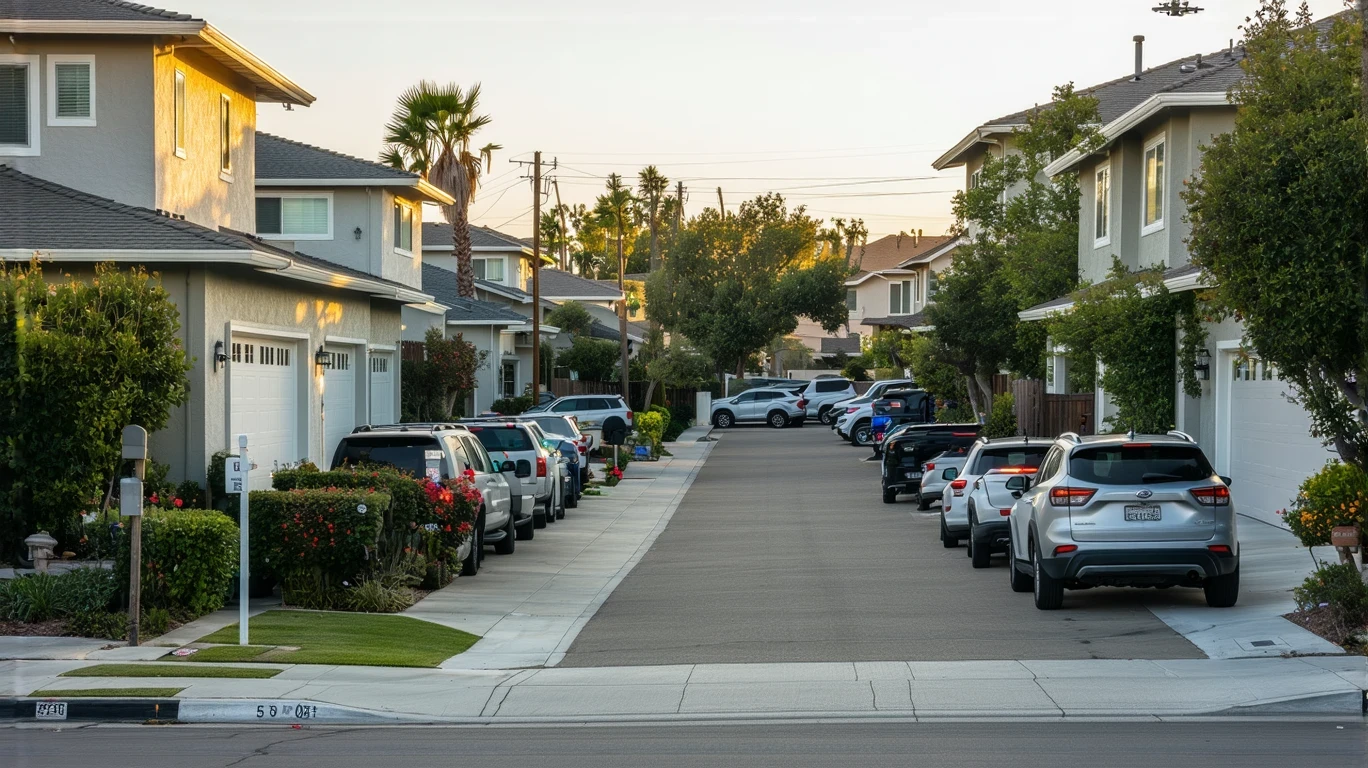
Oceanside does offer rail transit, and the pedestrian-to-road ratio exceeds high thresholds in certain areas, indicating walkable pockets where car dependence can be reduced. Cycling infrastructure is notable, with bike-to-road ratios also running high. For households located near transit stations or within walkable corridors, it’s possible to limit vehicle use and avoid some of the recurring fuel and maintenance costs that define car ownership.
But for most households, transportation means owning and operating at least one vehicle. That includes not just fuel, but insurance, registration, maintenance, and parking. The built environment in Oceanside is low-rise and mixed-use, which supports some walkability, but the city’s geographic spread and commute patterns still favor cars for reliability and range.
Transportation isn’t just a commute cost—it’s a recurring exposure that scales with household size, work locations, and daily routines. Households with two working adults, school-age children, or jobs outside Oceanside face compounding transportation expenses that rival or exceed housing in monthly impact.
Cost Exposure Profiles
Cost exposure in Oceanside is shaped by three structural factors: housing entry point, transportation dependence, and utility rate sensitivity. Households face different levels of financial pressure depending on how these factors combine.
Low-exposure situations: Renters in walkable pockets near rail transit, working locally or from home, with modest utility usage. These households avoid the compounding costs of ownership, long commutes, and high energy consumption. Their primary exposure is rent, which remains high but predictable within lease terms.
High-exposure situations: Homeowners with long commutes, multiple vehicles, and school-age children in larger homes. These households face mortgage payments, property tax, insurance, maintenance, high utility bills from cooling and occupancy, and significant transportation costs from fuel, insurance, and vehicle upkeep. The exposures stack, and each category rises over time.
The difference isn’t about income sufficiency—it’s about cost structure. A household earning the median income of $86,701 per year will experience Oceanside very differently depending on whether they’re renting a smaller unit near transit or owning a single-family home with a two-car commute. Both are common patterns here, and both are financially viable, but the margin for error and the sensitivity to cost increases vary widely.
Oceanside rewards proximity and planning. Households that can position themselves near work, transit, and services face lower recurring costs and more control over their financial exposure. Those who cannot—whether due to housing availability, affordability, or family needs—absorb higher costs across multiple categories, with less ability to reduce them through behavior alone.
How this article was built: In addition to public economic data, this article incorporates location-based experiential signals derived from anonymized geographic patterns—such as access density, walkability, and land-use mix—to reflect how day-to-day living actually feels in Oceanside, CA.
Frequently Asked Questions
Is Oceanside more affordable than San Diego in 2026? Yes, Oceanside generally runs less expensive than central San Diego, particularly for housing, though both cities operate well above national cost levels. The difference is meaningful for renters and buyers comparing entry costs, but Oceanside is not a “budget alternative”—it’s a moderately less expensive option within an expensive region.
What does a typical cost profile look like in Oceanside? A typical household faces high housing costs (whether renting or owning), elevated transportation expenses due to car dependence and expensive fuel, and significant utility bills driven by high electricity rates. Groceries and daily costs add steady pressure, and the combination leaves little room for cost reduction without structural changes like relocating closer to work or downsizing housing.
Do utilities cost more in Oceanside than in nearby cities? Electricity rates in Oceanside are among the highest in the country, consistent with broader Southern California pricing. Natural gas costs are also elevated, though usage tends to be lower due to mild winters. Utility costs here are higher than in most U.S. cities, though comparable to other coastal California communities.
What costs tend to surprise newcomers in Oceanside? Three costs surprise most newcomers: first, electricity bills that run far higher than expected even with modest usage due to the 30.29¢/kWh rate; second, the cumulative transportation expense from high gas prices and long commutes; and third, grocery costs that add up quickly for families cooking at home, with staples like ground beef at $11.99/lb and milk at $7.28 per half-gallon.
Are property taxes higher in Oceanside than in other California cities? Property taxes in California are governed by Proposition 13, which caps the base rate at 1% of assessed value plus voter-approved local assessments. Oceanside follows this structure, so effective property tax rates are comparable to other California cities. The absolute dollar amount will be higher here due to elevated home values, but the rate structure itself is not unusual for the state.
Can you live in Oceanside without a car? It’s possible in specific situations—households located near rail transit stations, within walkable corridors, and working locally or remotely can reduce or eliminate car dependence. Oceanside has notable cycling infrastructure and some walkable pockets, but the majority of residents still rely on cars for commuting, errands, and family logistics due to the city’s geographic spread and commute patterns.
How does the cost of living in Oceanside compare to inland Southern California cities? Oceanside tends to be more expensive than inland cities like Riverside, San Bernardino, or Temecula, primarily due to higher housing costs and proximity to the coast. However, it generally runs less expensive than central San Diego or Orange County coastal cities. The tradeoff is between housing pressure and location value—inland areas offer lower entry costs but longer commutes and less access to coastal amenities.
Is Oceanside a good place for families on a budget? Oceanside offers strong family infrastructure, with high playground density and moderate school availability, plus hospital access and mixed land use that supports some walkability. However, the cost structure is challenging for families on a budget—high housing costs, expensive utilities, elevated grocery prices, and transportation dependence create sustained financial pressure. Families can make it work, but it requires careful planning, proximity to work and services, and realistic expectations about recurring expenses.