Fountain Valley: Median home value $932,800, median rent $2,412/month, low-rise neighborhoods, bus-only transit, notable cycling infrastructure.
Santa Ana: Median home value $624,000, median rent $1,885/month, walkable pockets, rail transit present, stronger family infrastructure.
Both cities sit in Orange County, share the same regional price environment, and face identical utility rate structures. Yet the cost experience differs sharply—not because one is universally cheaper, but because cost pressure concentrates differently depending on what matters most to your household in 2026. Fountain Valley offers quieter, lower-density residential character with integrated parks and strong cycling infrastructure, but demands higher upfront housing investment. Santa Ana provides lower entry barriers, rail transit access, and more walkable urban pockets, but presents a different set of tradeoffs around density and neighborhood texture.
The decision between these two cities isn’t about finding the lowest total—it’s about understanding where your household feels cost pressure most acutely, and which city’s structure aligns with how you actually live day to day.
Housing Costs
Housing entry costs create the starkest difference between Fountain Valley and Santa Ana. Fountain Valley’s median home value sits at $932,800, while Santa Ana’s stands at $624,000. For renters, Fountain Valley’s median gross rent reaches $2,412 per month compared to Santa Ana’s $1,885 per month. These aren’t small variations—they represent fundamentally different barriers to securing housing and different ongoing obligations once you’re in.
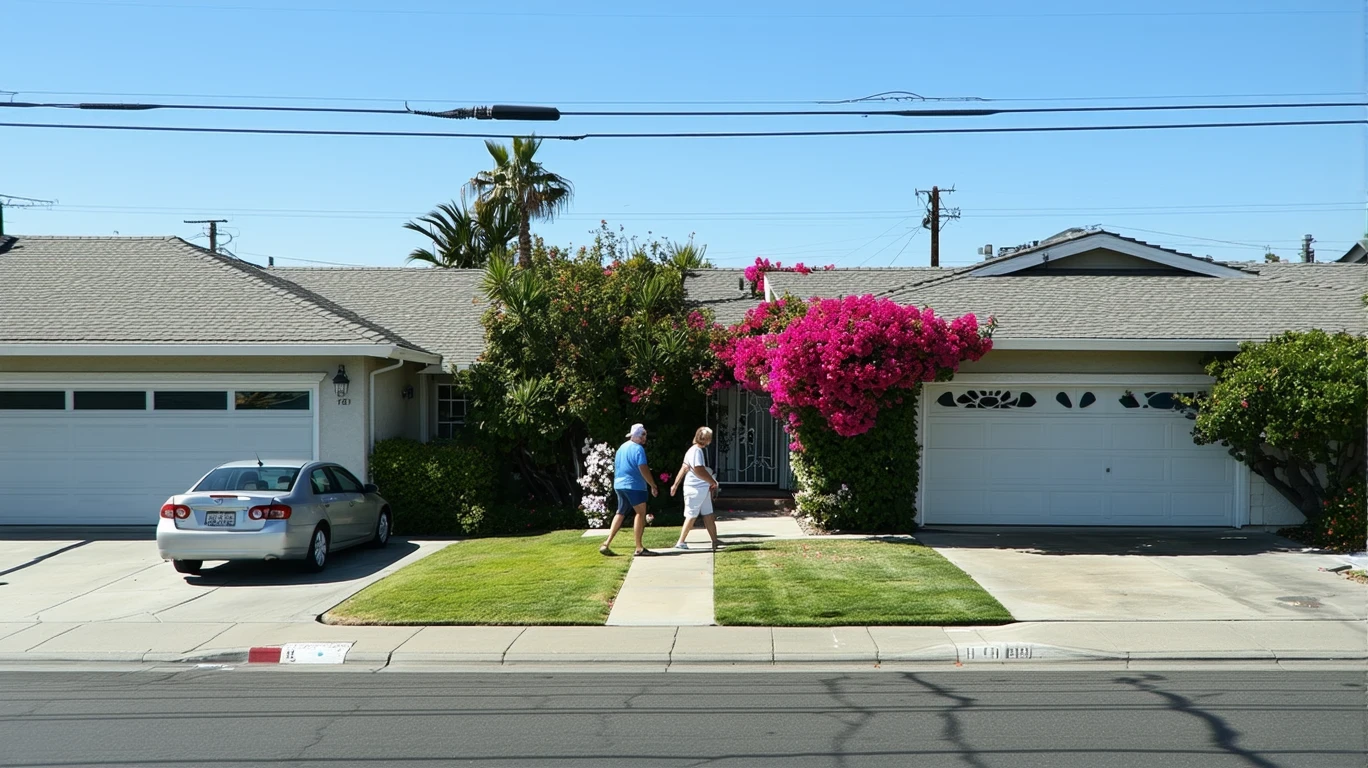
Fountain Valley’s housing stock skews toward single-family homes in low-rise neighborhoods, which drives both the higher entry barrier and the character of ongoing costs. Homeowners face larger mortgage obligations, higher property tax assessments, and greater exposure to maintenance and insurance costs tied to larger properties. Renters in Fountain Valley typically occupy single-family rentals or townhomes rather than large apartment complexes, which means rent includes more square footage but also more responsibility for yard maintenance, utilities scaled to larger spaces, and sometimes HOA fees even as a tenant.
Santa Ana’s housing market offers more variety in form and price point. The mixed building height profile means apartments, condos, and single-family homes coexist, creating more entry points for both renters and buyers. Lower median home values don’t eliminate housing pressure—$624,000 still represents a substantial barrier—but they open access to households earning closer to the county median. Renters benefit from more apartment inventory, which tends to bundle utilities or limit exposure to variable costs tied to home size. However, walkable pockets and higher-density corridors can mean trade-offs in parking availability, noise, and private outdoor space.
| Housing Type | Fountain Valley | Santa Ana |
|---|---|---|
| Median Home Value | $932,800 | $624,000 |
| Median Gross Rent | $2,412/month | $1,885/month |
| Dominant Housing Form | Low-rise, single-family | Mixed height, varied forms |
First-time buyers face higher down payment requirements and larger monthly mortgage obligations in Fountain Valley, which limits access unless household income substantially exceeds the county median of $108,860 per year in Fountain Valley (compared to $84,210 per year in Santa Ana). Families prioritizing yard space, lower density, and quieter streets may find Fountain Valley’s housing stock worth the premium, but only if the entry barrier doesn’t destabilize other budget categories. Renters seeking predictable, lower-obligation housing may find Santa Ana’s apartment inventory easier to navigate, though rent savings don’t eliminate cost pressure—they shift it toward transportation, parking, and managing daily errands in denser surroundings.
Housing takeaway: Fountain Valley imposes higher entry barriers and ongoing obligations, but delivers lower-density residential character with more private space. Santa Ana offers lower entry costs and more housing form variety, but requires navigating denser neighborhoods and potentially less parking or outdoor access. Households with higher incomes and a preference for single-family living absorb Fountain Valley’s premium more easily; households prioritizing lower entry barriers and walkable urban texture find Santa Ana’s structure more accessible.
Utilities and Energy Costs
Both cities face identical electricity rates at 31.91¢/kWh and nearly identical natural gas prices (Fountain Valley at $21.89/MCF, Santa Ana at $21.94/MCF). This means the difference in utility exposure comes entirely from housing form, home size, and how households use energy—not from rate structures or regional pricing.
Fountain Valley’s low-rise, single-family housing stock creates larger conditioned spaces, which translates to higher baseline electricity and gas consumption. Cooling a 1,800-square-foot single-family home through Orange County’s warm, dry summers demands more energy than cooling a 900-square-foot apartment, even at the same rate per kilowatt-hour. Older single-family homes—common in established suburban neighborhoods—often lack modern insulation, efficient HVAC systems, or double-pane windows, amplifying seasonal swings in utility bills. Households in Fountain Valley experience more volatility tied to home size and age, with summer cooling and winter heating (minimal but present) driving the largest spikes.
Santa Ana’s mixed building height profile means more residents live in apartments or condos with shared walls, which naturally moderates heating and cooling exposure. Smaller individual units require less energy to maintain comfortable temperatures, and newer apartment construction often includes more efficient systems and better insulation than older single-family stock. However, renters in older buildings or ground-floor units may still face significant cooling costs during peak summer months, and those in buildings without central air may rely on window units that drive up electricity usage inefficiently.
Utility cost exposure varies sharply by household size and housing type in both cities. Single adults or couples in Santa Ana apartments benefit from lower baseline usage and shared-wall efficiency, keeping monthly utility bills more predictable and manageable. Families in Fountain Valley single-family homes face higher baseline costs and greater seasonal volatility, but gain more control over efficiency upgrades (insulation, HVAC replacement, solar installation) if they own the property. Renters in either city have limited ability to reduce structural inefficiency, making housing form and building age the dominant factors in utility exposure rather than rate differences.
Utility takeaway: Identical rate structures mean housing form drives all utility differences. Fountain Valley households experience higher baseline usage and more seasonal volatility due to larger single-family homes, while Santa Ana households in apartments benefit from shared-wall efficiency and smaller conditioned spaces. Families in larger homes face more exposure; single adults and couples in apartments enjoy more predictability.
Groceries and Daily Expenses
Both Fountain Valley and Santa Ana show high food and grocery establishment density, meaning access to supermarkets, discount grocers, and everyday shopping isn’t a structural barrier in either city. The difference lies in how shopping patterns interact with neighborhood form, transportation habits, and the trade-off between convenience and price sensitivity.
Fountain Valley’s low-rise, car-oriented layout encourages bulk shopping trips to big-box stores and warehouse clubs, where households can stock up on staples at lower per-unit prices. The trade-off is that this pattern requires car access, storage space (which single-family homes provide), and the discipline to plan meals around what’s already in the pantry rather than grabbing convenience items on the way home. Families managing larger grocery volumes benefit from this structure, but it also creates pressure to own and maintain a vehicle, absorb gas costs for dedicated shopping trips, and resist the convenience creep of last-minute takeout or prepared foods when planning breaks down.
Santa Ana’s walkable pockets and mixed land use mean more residents live within walking distance of smaller grocery stores, corner markets, and food establishments. This reduces the friction of daily errands and makes it easier to pick up fresh items without a dedicated car trip. However, smaller-format stores often carry higher per-unit prices than big-box competitors, and the convenience of nearby dining and takeout options can quietly inflate monthly food spending. Single adults and couples benefit from the flexibility to shop frequently in small quantities without needing a car, but families managing larger volumes may find themselves paying a premium for convenience or making frequent trips that add up in time cost.
Dining out and convenience spending patterns differ based on access and routine. Fountain Valley’s residential character means fewer restaurants and cafés within walking distance, which can reduce spontaneous spending but also limits options for quick, affordable meals when cooking feels like too much effort. Santa Ana’s denser commercial corridors and mixed-use neighborhoods put more food options within easy reach, which increases flexibility but also temptation—grabbing coffee, lunch, or takeout becomes easier and more frequent, and those small purchases accumulate faster than planned grocery trips.
Grocery takeaway: Both cities offer strong grocery access, but cost pressure shows up differently. Fountain Valley households benefit from big-box pricing and bulk shopping but absorb car dependence and storage requirements. Santa Ana households gain walkable convenience and flexibility but face higher per-unit prices at smaller stores and more exposure to convenience spending creep. Families prioritizing volume and price control fit Fountain Valley’s structure; single adults and couples valuing walkable errands and flexibility fit Santa Ana’s.
Taxes and Fees
Property taxes in both cities follow California’s Proposition 13 framework, which caps annual increases at 2% for existing homeowners and resets assessed value at purchase. This means the primary difference in property tax exposure comes from purchase price, not rate structure. Fountain Valley homeowners purchasing at $932,800 face higher annual property tax bills than Santa Ana homeowners purchasing at $624,000, and that gap persists as long as both households remain in their homes. For long-term residents who purchased years ago, the difference narrows over time as both assessments rise slowly from their respective baselines.
Sales tax rates in Orange County apply uniformly across both cities, so differences in consumption tax burden come entirely from spending patterns rather than rate variation. Households making larger purchases—furniture, appliances, vehicles—absorb the same percentage regardless of location, but the frequency and scale of those purchases vary by housing type. Fountain Valley homeowners in single-family homes replace HVAC systems, water heaters, and major appliances more often than Santa Ana apartment renters, whose landlords typically cover those capital expenses. This shifts sales tax exposure toward homeowners and away from renters, independent of city.
HOA fees and special assessments appear more frequently in Fountain Valley’s single-family neighborhoods, particularly in planned communities with shared amenities like pools, landscaping, or private streets. These fees range widely but represent ongoing, non-negotiable obligations that don’t fluctuate with usage. Santa Ana’s denser housing stock includes more apartment buildings and condos, where HOA or association fees may cover water, trash, or exterior maintenance—bundling costs that would otherwise appear as separate line items. The predictability differs: Fountain Valley HOAs tend to be stable but add a fixed monthly cost; Santa Ana rental agreements may include utilities or services that vary by building.
Trash, water, and sewer fees vary by provider and housing type rather than city policy. Single-family homeowners in Fountain Valley typically pay these as separate monthly bills, while Santa Ana apartment renters often see them bundled into rent or covered by the landlord. This doesn’t eliminate the cost—it shifts who pays and how visible it is. Homeowners gain transparency but absorb volatility; renters gain simplicity but lose control over usage-based savings.
Taxes and fees takeaway: Property tax exposure tracks purchase price, making Fountain Valley homeowners more exposed due to higher home values. HOA fees appear more often in Fountain Valley’s planned communities, adding predictable but non-negotiable costs. Santa Ana renters benefit from bundled utilities and landlord-covered fees, while Fountain Valley homeowners face more separate, visible bills. Long-term homeowners in both cities benefit from Prop 13’s assessment cap, but the initial gap persists.
Transportation & Commute Reality
Transportation infrastructure creates one of the clearest structural differences between Fountain Valley and Santa Ana. Santa Ana offers rail transit service, while Fountain Valley relies on bus-only coverage. For households commuting to job centers accessible by rail—such as downtown Los Angeles, Anaheim, or Irvine—Santa Ana provides a viable alternative to driving that Fountain Valley simply doesn’t match. Rail access doesn’t eliminate car dependence for most households, but it reduces the frequency of driving, lowers exposure to gas price volatility (Fountain Valley at $4.56/gal, Santa Ana at $4.34/gal), and shifts commute time from behind the wheel to reading, working, or resting.
Fountain Valley’s mobility texture sits in the “mixed” category, meaning moderate pedestrian infrastructure supports some walking and biking but doesn’t eliminate car reliance for most errands. The city shows notable cycling infrastructure, with bike-to-road ratios exceeding high thresholds, which benefits recreational riders and households comfortable biking to nearby destinations. However, the low-rise, residential character means most daily destinations—grocery stores, schools, medical appointments—require a car unless you live in one of the pockets with denser commercial access. Bus service exists but operates on schedules and routes that rarely compete with the convenience of driving.
Santa Ana’s walkable pockets and higher pedestrian-to-road ratio mean more residents can complete some errands on foot, particularly in neighborhoods near commercial corridors or mixed-use developments. Rail transit adds a meaningful option for commuters, especially those working in job centers along the line. However, cycling infrastructure shows lower density than Fountain Valley, and car ownership remains the norm for most households navigating beyond their immediate neighborhood. The difference isn’t car-free versus car-dependent—it’s how often you must drive and whether alternatives exist for specific, high-frequency trips.
Commute patterns interact with housing costs in both cities. Fountain Valley households absorbing higher housing costs may justify the premium by shorter or more predictable car commutes, particularly if they work in nearby Orange County job centers. Santa Ana households benefit from lower housing entry costs but may face longer or more complex commutes if their jobs sit outside rail-accessible corridors, requiring the same car dependence as Fountain Valley but without the residential quiet or space. Time cost versus cash cost becomes the trade-off: Fountain Valley offers more residential predictability at higher cash outlay; Santa Ana offers lower entry barriers but potentially more time spent navigating denser streets or transferring between transit modes.
Cost Structure Comparison
Housing dominates the cost experience in both cities, but the nature of that dominance differs. Fountain Valley imposes a higher entry barrier and larger ongoing obligations, concentrating financial pressure at the point of securing housing and in monthly mortgage or rent payments. Households able to clear that threshold gain access to lower-density neighborhoods, more private space, and integrated parks, but they carry that housing cost as the largest, least flexible line item in their budget. Santa Ana’s lower entry costs and rent obligations don’t eliminate housing pressure—they reduce it enough to open access to households closer to the county median income, but those households still dedicate substantial portions of income to rent or mortgage.
Utilities introduce more volatility in Fountain Valley due to larger single-family homes and older housing stock. Seasonal swings in cooling and heating costs hit harder when you’re conditioning 1,800 square feet instead of 900, and older homes amplify that exposure through inefficient systems and poor insulation. Santa Ana households in apartments benefit from shared-wall efficiency and smaller spaces, keeping utility bills more predictable and manageable. This difference compounds over time—Fountain Valley households face both higher baseline costs and sharper seasonal spikes, while Santa Ana households enjoy steadier, lower monthly obligations.
Transportation patterns matter more in Fountain Valley, where car dependence is nearly universal and alternatives remain limited to bus service and cycling for those comfortable with it. Santa Ana’s rail access and walkable pockets reduce the frequency of driving for some households, particularly those commuting to rail-accessible job centers or living near commercial corridors. However, car ownership remains the norm in both cities, and the difference lies in how often you must drive rather than whether you need a car at all. Fountain Valley households absorb higher gas costs and more frequent driving; Santa Ana households gain occasional alternatives that lower overall transportation exposure without eliminating it.
Daily living costs—groceries, dining, convenience spending—show similar access in both cities but different friction. Fountain Valley’s car-oriented layout encourages bulk shopping and big-box pricing, which benefits families managing large volumes but requires storage space, vehicle access, and planning discipline. Santa Ana’s walkable errands and nearby food options reduce friction for single adults and couples, but higher per-unit prices at smaller stores and easier access to takeout create more opportunities for convenience spending to creep upward. The difference isn’t about total grocery costs—it’s about whether you’re optimizing for price control or time flexibility.
For households sensitive to housing entry barriers, Santa Ana offers a clearer path to securing a place without destabilizing the rest of the budget. For households prioritizing residential quiet, private space, and lower-density neighborhoods, Fountain Valley’s premium buys those qualities but demands higher income to absorb the cost without strain. The better choice depends on which costs dominate your household’s decision-making: if housing entry and ongoing rent feel like the breaking point, Santa Ana’s structure fits better; if you can clear Fountain Valley’s threshold and value what that premium buys, the trade-off makes sense.
How the Same Income Feels in Fountain Valley vs Santa Ana
Single Adult
Housing becomes non-negotiable first, and Fountain Valley’s higher rent or mortgage obligations claim a larger share of gross monthly income before utilities, transportation, or groceries enter the picture. Santa Ana’s lower rent opens more flexibility for discretionary spending, building savings, or absorbing unexpected costs without immediate strain. Commute friction plays a smaller role for single adults, but Santa Ana’s rail access and walkable errands reduce the frequency of driving, lowering transportation exposure. Fountain Valley requires more driving for daily tasks, which adds time cost and gas expense but delivers quieter residential surroundings and more private space if that matters to your routine.
Dual-Income Couple
Housing pressure eases with two incomes, but Fountain Valley’s entry barrier still demands careful budgeting and limits flexibility for other goals like travel, dining out, or saving for a home purchase. Santa Ana’s lower housing costs free up income for lifestyle spending or faster savings accumulation, but denser surroundings and less private outdoor space may feel like a trade-off depending on how you spend time at home. Transportation becomes more complex with two commutes—if both partners work in rail-accessible job centers, Santa Ana’s transit options reduce car dependence and parking costs; if one or both commute to suburban office parks, Fountain Valley’s car-oriented layout may feel more predictable and less time-intensive than navigating Santa Ana’s denser streets.
Family with Kids
Housing space needs become non-negotiable, and Fountain Valley’s single-family stock delivers yards, multiple bedrooms, and proximity to parks without requiring a search for rare, expensive options. Santa Ana’s stronger family infrastructure—higher school and playground density—means more amenities within reach, but finding comparable housing space at accessible prices becomes harder as family size grows. Utility costs hit families harder in Fountain Valley due to larger homes and more occupants driving up baseline usage, while Santa Ana families in apartments benefit from shared-wall efficiency but sacrifice private outdoor play space. Time budget pressures intensify with kids—Fountain Valley’s car dependence adds driving time for school drop-offs, errands, and activities, while Santa Ana’s walkable pockets and transit options reduce some of that friction but require navigating denser streets and managing parking constraints.
Decision Matrix: Which City Fits Which Household?
| Decision factor | If you’re sensitive to this… | Fountain Valley tends to fit when… | Santa Ana tends to fit when… |
|---|---|---|---|
| Housing entry + space needs | You need lower upfront costs or prioritize square footage and private outdoor space | You can absorb higher entry barriers and value single-family residential character with integrated parks | You need lower entry costs and can trade private space for walkable access and mixed-use neighborhoods |
| Transportation dependence + commute friction | You want alternatives to driving or work in rail-accessible job centers | You’re comfortable with car dependence and value cycling infrastructure for recreation or short trips | Your commute benefits from rail access or you prioritize walkable errands over car convenience |
| Utility variability + home size exposure | You want predictable monthly bills and lower baseline energy usage | You can absorb higher baseline costs and seasonal volatility in exchange for larger living space | You prefer smaller conditioned spaces and shared-wall efficiency that moderates utility swings |
| Grocery strategy + convenience spending creep | You optimize for per-unit price control or need walkable access to daily errands | You have car access, storage space, and discipline to plan bulk shopping trips for lower prices | You value walkable convenience and flexibility even if per-unit prices run higher at smaller stores |
| Fees + friction costs (HOA, services, upkeep) | You want bundled, predictable costs or prefer transparency and control over separate bills | You accept HOA fees and separate utility bills in exchange for ownership control and residential amenities | You prefer landlord-covered fees and bundled utilities that simplify monthly obligations |
| Time budget (schedule flexibility, errands, logistics) | You need to minimize driving time or value walkable access to reduce daily friction | You prioritize residential quiet and predictable car commutes over walkable errands | You benefit from rail transit, walkable pockets, and reduced driving frequency for daily tasks |
Lifestyle Fit
Fountain Valley delivers a quieter, lower-density residential experience with integrated parks and water features that exceed high density thresholds. The city’s notable cycling infrastructure supports recreational riding and short trips for those comfortable biking, though car dependence remains the norm for most errands and commutes. Bus service provides basic transit coverage, but schedules and routes rarely compete with the convenience of driving. The low-rise building character and mixed land use create a suburban texture where residential streets dominate and commercial activity concentrates along specific corridors rather than spreading throughout neighborhoods.
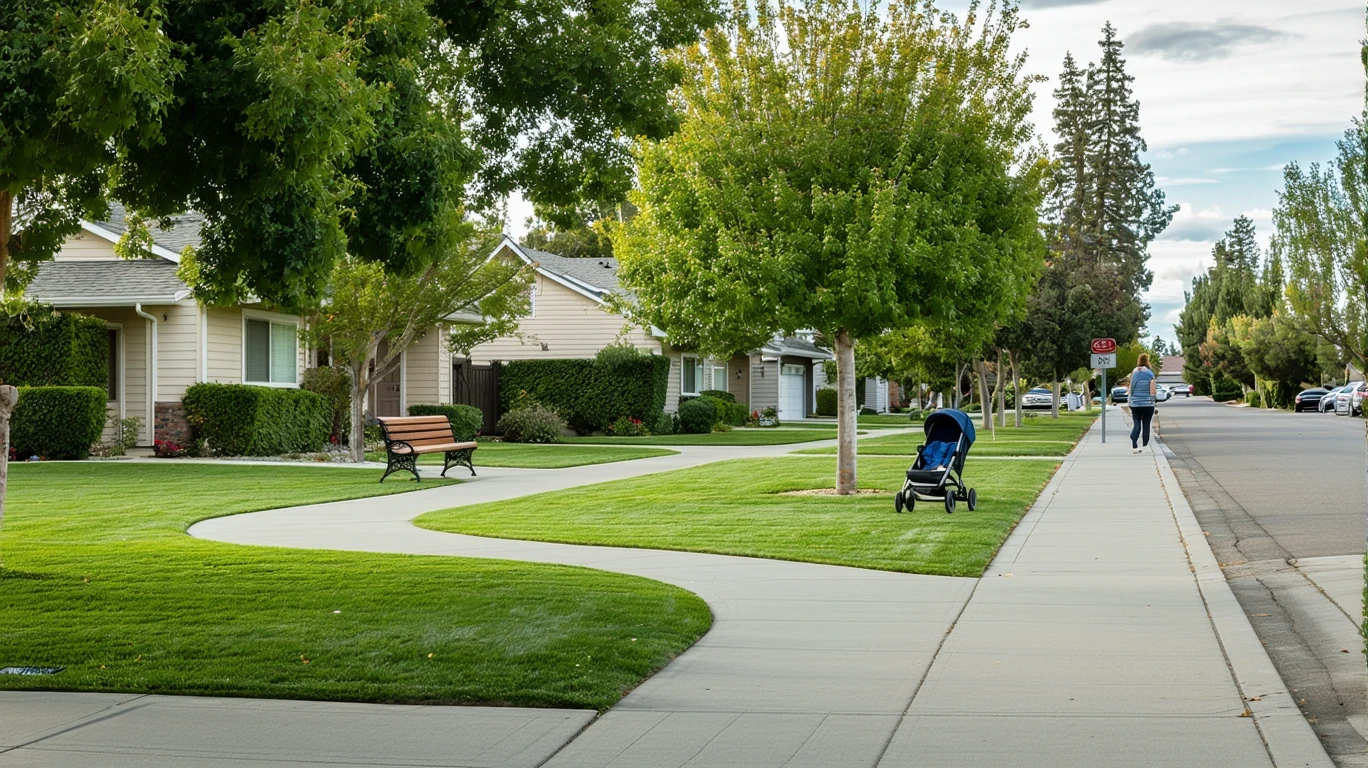
Santa Ana offers more urban texture with walkable pockets where pedestrian infrastructure supports daily errands on foot. Rail transit access opens commuting options to job centers along the line, reducing car dependence for households whose work and routines align with transit coverage. The city’s mixed building height profile means more variety in housing form—apartments, condos, and single-family homes coexist, creating denser neighborhoods with more commercial activity within walking distance. Stronger family infrastructure, with both schools and playgrounds meeting density thresholds, benefits households with children seeking amenities close to home.
Both cities share integrated green space access and high food and grocery establishment density, meaning parks, outdoor recreation, and everyday shopping don’t create structural barriers in either location. The difference lies in how you navigate daily life: Fountain Valley’s layout assumes car access and rewards households comfortable with driving for most tasks, while Santa Ana’s walkable pockets and transit options reduce friction for those living near commercial corridors or commuting along rail lines. Lifestyle costs show up indirectly—Fountain Valley’s car dependence adds transportation time and expense, while Santa Ana’s denser surroundings may increase convenience spending and reduce private outdoor space.
Fountain Valley median household income: $108,860 per year
Santa Ana median household income: $84,210 per year
Both cities: Unemployment rate 3.9%, identical regional price parity index, similar Southern California coastal climate with warm, dry summers and mild winters.
Frequently Asked Questions
Is Fountain Valley or Santa Ana more affordable for renters in 2026?
Santa Ana shows lower median gross rent at $1,885 per month compared to Fountain Valley’s $2,412 per month, which reduces the entry barrier and ongoing monthly obligation for renters. However, affordability depends on household income, housing form preferences, and whether you value lower rent over private space and quieter residential surroundings. Fountain Valley’s higher rent typically buys single-family rentals or townhomes with more square footage and private outdoor space, while Santa Ana’s apartment inventory offers lower costs but denser living conditions. Renters prioritizing lower monthly obligations and walkable access fit Santa Ana’s structure better; those seeking more space and residential quiet may find Fountain Valley’s premium worth absorbing if income supports it.
How do transportation costs differ between Fountain Valley and Santa Ana in 2026?
Transportation costs differ more in structure than in gas prices—Fountain Valley’s gas sits at $4.56/gal compared to Santa Ana’s $4.34/gal, a minor gap that matters less than how often you must drive. Fountain Valley relies on bus-only transit and assumes car dependence for most errands and commutes, while Santa Ana offers rail transit access that reduces driving frequency for households commuting to rail-accessible job centers. Santa Ana’s walkable pockets also lower the need for short car trips to groceries or services, though car ownership remains the norm in both cities. Households whose routines align with Santa Ana’s transit and walkable corridors experience lower transportation exposure; those commuting to suburban job centers or prioritizing car convenience may find Fountain Valley’s layout more predictable.
Which city has higher utility bills, Fountain Valley or Santa Ana, in 2026?
Electricity and natural gas rates are virtually identical in both cities, so utility bill differences come entirely from housing form and home size. Fountain Valley’s low-rise, single-family housing stock creates larger conditioned spaces that drive higher baseline electricity and gas usage, particularly for cooling during warm summers. Santa Ana’s mixed building height profile means more residents live in apartments with shared walls, which moderates heating and cooling exposure and keeps bills more predictable. Families in Fountain Valley single-family homes face higher baseline costs and more seasonal volatility; single adults and couples in Santa Ana apartments benefit from lower usage and steadier monthly bills. Housing type matters more than city when predicting utility exposure.
Does Fountain Valley or Santa Ana offer better access to groceries and daily errands in 2026?
Both cities show high food and grocery establishment density, meaning access to supermarkets and everyday shopping isn’t a structural barrier in either location. The difference lies in how you reach those stores and what shopping patterns fit your routine. Fountain Valley’s car-oriented layout encourages bulk shopping trips to big-box stores with lower per-unit prices, which benefits families managing large volumes but requires vehicle access and storage space. Santa Ana’s walkable pockets put smaller grocery stores and food options within walking distance, reducing friction for single adults and couples who prefer frequent, small shopping trips. Convenience spending creep—grabbing takeout, coffee, or prepared foods—shows up more easily in Santa Ana due to denser commercial access, while Fountain Valley’s residential character limits spontaneous spending but demands more planned, car-based shopping.
How do housing costs in Fountain Valley compare to Santa Ana for first-time homebuyers in 2026?
Fountain Valley’s median home value of $932,800 creates a substantially higher entry barrier than Santa Ana’s $624,000, requiring larger down payments and higher monthly mortgage obligations. First-time buyers in Fountain Valley need income well above the county median to absorb those costs without destabilizing other budget categories, while Santa Ana’s lower home values open access to buyers closer to median income levels. However, lower entry costs in Santa Ana don’t eliminate housing pressure—they reduce it enough to make homeownership feasible for more households, but buyers still face substantial monthly obligations and competition for available inventory. Fountain Valley’s premium buys lower-density neighborhoods, more private space, and integrated parks; Santa Ana’s lower costs provide access to mixed-use neighborhoods, walkable pockets, and stronger family infrastructure. The better fit depends on whether you can absorb Fountain Valley’s entry barrier and value what that premium delivers.
Conclusion
Fountain Valley and Santa Ana sit in the same county, share identical utility rates, and face similar regional economic conditions, yet the cost experience differs sharply because pressure concentrates in different places. Fountain Valley demands higher housing entry costs and ongoing obligations, but delivers lower-density residential character, integrated parks, and notable cycling infrastructure. Santa Ana offers lower entry barriers, rail transit access, and walkable urban pockets, but requires navigating denser surroundings and potentially less private space.