Fountain Valley is considered expensive in 2026, with a median home value of $932,800 anchoring housing pressure across the city. The value proposition depends on housing entry cost versus car dependence, though strong daily errands accessibility and notable bike infrastructure offer some relief from vehicle-only logistics.
Overall Cost of Living Snapshot
Is the true cost of living higher than you think? In Fountain Valley, the answer hinges less on day-to-day prices and more on two structural realities: the barrier to housing entry and the recurring exposure of car ownership. The city’s regional price parity index sits at 100, meaning costs align closely with the broader baseline—but that baseline is Orange County, where housing dominates the financial landscape.
Median household income stands at $108,860 per year (roughly $9,072 gross monthly), which sounds substantial until measured against a $932,800 median home value or $2,412 monthly rent. Unemployment is low at 3.9%, reflecting a stable local economy, but stability doesn’t reduce the magnitude of fixed costs. Electricity runs 31.91¢ per kWh, natural gas costs $21.89 per MCF, and gasoline sits at $4.56 per gallon—all elevated but predictable within California’s cost structure.
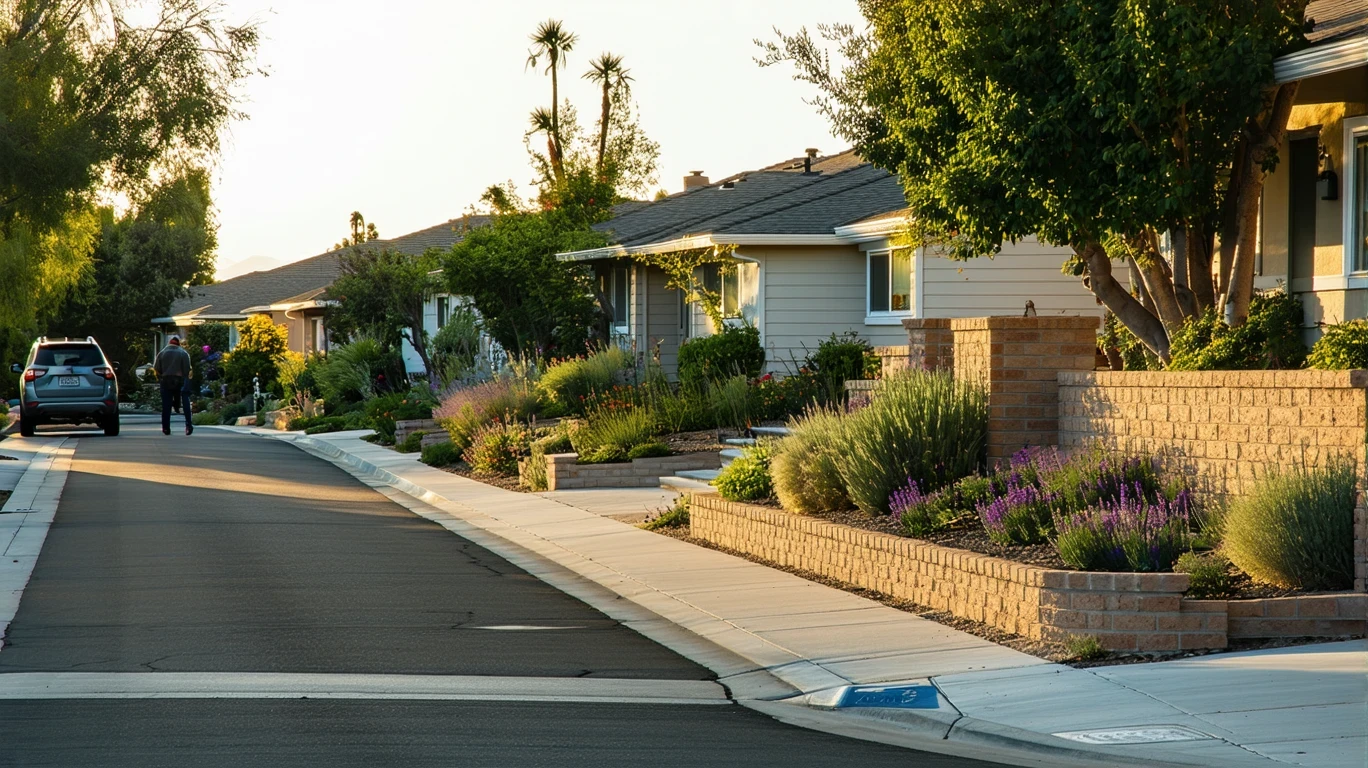
What shapes cost structure here isn’t volatility or unpredictability—it’s the sheer weight of housing and the necessity of vehicle access, moderated slightly by the city’s layout. Fountain Valley offers broadly accessible food and grocery options, with densities exceeding high thresholds, and notable cycling infrastructure that provides an alternative to driving for short trips. Parks are plentiful, with integrated green space access supported by water features. The pedestrian-to-road ratio sits in the medium band, meaning the city supports both walking and driving, though it’s not uniformly walkable. Bus service is present, but rail transit is absent, reinforcing car dependency for longer trips or commutes outside the immediate area.
Driver verdict: Housing entry cost dominates financial pressure, with transportation dependency as the second-largest recurring exposure. Surprises come not from prices themselves but from the cumulative burden of maintaining vehicle access in a region where alternatives exist only for limited use cases.
Housing Costs (Primary Driver)
Housing is the single largest cost factor in Fountain Valley, and the gap between renting and owning is wide enough to define entirely different financial profiles. The median home value of $932,800 places ownership out of reach for many households, even those earning well above the city’s median income. Median gross rent of $2,412 per month is steep but avoids the capital requirements, maintenance volatility, and property tax exposure that come with ownership.
Renters face a high baseline but gain predictability and mobility. Owners absorb not just the mortgage but insurance, taxes, and the long-term risk of deferred maintenance—all of which compound in a high-value market. The city’s low-rise building character and mixed land use mean that housing stock is primarily single-family homes and smaller multifamily structures, limiting rental inventory and keeping competition high.
For households weighing renting vs owning, the decision turns on time horizon and capital availability. Renting makes sense for those prioritizing flexibility or lacking substantial savings. Ownership makes sense only for those prepared to stay long enough to absorb transaction costs and weather market shifts.
Conclusion: Fountain Valley is a buying market for established households with significant capital and a long-term commitment. For everyone else, it’s a high-cost rental market with limited turnover.
| Housing Type | Cost Anchor | What That Buys You |
|---|---|---|
| Median Home Value | $932,800 | Ownership equity, maintenance responsibility, tax and insurance exposure |
| Median Rent | $2,412/month | Flexibility, predictable monthly cost, no capital requirement |
Utilities & Energy Risk
Electricity in Fountain Valley costs 31.91¢ per kWh, which is elevated compared to much of the country but typical for California. Natural gas is priced at $21.89 per MCF (roughly equivalent to 100 therms), and while heating demand is minimal in this mild coastal climate, gas is often used for water heating and cooking. The city’s location in Orange County means summers are warm but not extreme, and winters are mild, so utility volatility is driven more by usage patterns than by seasonal swings.
Air conditioning use rises during warmer months, but the absence of prolonged triple-digit heat keeps cooling costs manageable. Heating costs are negligible. The primary exposure comes from baseline electricity consumption—lighting, appliances, electronics—which runs year-round and scales with household size and behavior.
Risk classification: moderate. Utilities are a recurring cost but not a major swing factor. Households can control exposure through efficiency measures and usage discipline, but the baseline rate structure ensures that even conservative users face noticeable monthly bills.
Groceries & Daily Costs
Grocery costs in Fountain Valley reflect the broader California price environment, with the regional price parity index at 100 indicating alignment with the state baseline. Derived estimates suggest bread runs around $1.84 per pound, chicken $2.04 per pound, eggs $2.58 per dozen, and milk $4.10 per half-gallon. Ground beef sits at $6.75 per pound, and cheese at $4.84 per pound. These figures are illustrative, derived from national baselines adjusted by regional price parity, and should be verified locally.
What matters more than individual item prices is the city’s infrastructure for daily errands. Fountain Valley shows high food and grocery establishment density, meaning residents have broadly accessible options without needing to drive long distances. This reduces the friction and time cost of routine shopping, even if prices themselves remain elevated. The presence of mixed land use and integrated green space also means that errands can sometimes be combined with other activities, lowering the effective burden of maintaining a household.
For households managing tight budgets, the accessibility of grocery options provides some relief—not through lower prices, but through reduced logistical complexity and the ability to shop more frequently in smaller increments, avoiding waste.
Transportation Reality
Transportation in Fountain Valley is shaped by car dependency, moderated slightly by the city’s notable cycling infrastructure and bus service. The bike-to-road ratio exceeds high thresholds, meaning dedicated bike lanes and paths are present throughout parts of the city, offering a viable alternative for short trips, errands, and recreational travel. Bus stops are present, providing some public transit access, but the absence of rail means longer commutes or trips outside the immediate area require a personal vehicle.
Gasoline costs $4.56 per gallon, which is elevated but consistent with California pricing. The real exposure comes not from fuel alone but from the cumulative cost of vehicle ownership: insurance, maintenance, registration, and depreciation. Households relying on a car for commuting, school runs, and errands face a recurring financial burden that scales with distance and frequency.
For bike-capable households—those with short commutes, nearby schools, or flexible schedules—the city’s infrastructure offers meaningful cost relief. Routine errands, given the high density of food and grocery establishments, can often be completed without a car. But for households with longer commutes, multiple vehicles, or inflexible schedules, transportation becomes a major recurring exposure, second only to housing.
The pedestrian-to-road ratio sits in the medium band, meaning some areas support walking, but the city is not uniformly walkable. Getting around without a car is possible for limited use cases but not practical for most households.
Cost Exposure Profiles
Cost exposure in Fountain Valley is defined by three primary factors: housing entry cost, transportation dependency, and the degree to which a household can leverage the city’s accessible errands infrastructure and bike network.
Low-exposure situations: Renters with stable leases, short commutes, and the ability to bike or walk for errands face the lowest recurring cost pressure. These households avoid the capital and maintenance burdens of homeownership and can minimize vehicle use, reducing both fuel and upkeep costs. Access to broadly distributed grocery and food options means daily logistics remain simple and time-efficient.
High-exposure situations: Homebuyers entering the market face the steepest barrier, with a $932,800 median home value requiring substantial savings and long-term financial commitment. Multi-vehicle households with long commutes or inflexible schedules absorb the full weight of California fuel prices and vehicle ownership costs. Families with school-age children face additional complexity, as school density is below low thresholds, potentially requiring longer drop-off and pick-up trips.
The difference between these profiles is structural, not behavioral. A household’s cost exposure is determined primarily by housing tenure, commute length, and vehicle count—not by spending habits or lifestyle choices. Fountain Valley’s layout offers some relief through accessible errands and bike infrastructure, but these advantages are meaningful only for households whose circumstances allow them to be used.
Frequently Asked Questions
Is Fountain Valley more affordable than nearby Orange County cities in 2026? Fountain Valley’s median home value of $932,800 and median rent of $2,412 place it in the expensive tier, though specific comparisons depend on which nearby cities are considered. Directionally, it aligns with broader Orange County cost pressures rather than offering notable relief.
What does a typical cost profile look like in Fountain Valley? Housing dominates, followed by transportation costs tied to vehicle ownership. Utilities are moderate, and groceries reflect California pricing but benefit from high local accessibility. The profile is defined more by fixed structural costs than by variable day-to-day expenses.
Do utilities cost more in Fountain Valley than nearby areas? Electricity at 31.91¢ per kWh and natural gas at $21.89 per MCF are consistent with California rates. Utilities are elevated compared to national averages but not outliers within the region. Seasonal swings are mild due to the coastal climate.
What costs tend to surprise newcomers in Fountain Valley? The cumulative burden of vehicle ownership—fuel, insurance, maintenance, registration—often exceeds expectations, especially for households accustomed to transit-rich environments. The gap between renting and owning is also wider than many anticipate, given the high median home value.
Are property taxes higher in Fountain Valley than nearby cities? Property tax rates in California are governed by Proposition 13, which caps increases and ties assessments to purchase price. Fountain Valley follows the same structure as other California cities, so differences are driven by home value rather than rate variation.
Can you live in Fountain Valley without a car? Possible for limited use cases—short commutes, nearby errands, bike-capable trips—but not practical for most households. Bus service is present, but the absence of rail and the medium pedestrian-to-road ratio mean car dependency remains the norm for longer trips and inflexible schedules.
How does Fountain Valley’s cost structure compare to inland California cities? Fountain Valley tends to be more expensive due to its Orange County location, particularly in housing. Inland cities often offer lower home values and rents, though they may face higher cooling costs due to hotter summers. Transportation costs are similarly elevated across California due to fuel prices.
What makes Fountain Valley expensive beyond housing? Transportation dependency is the second-largest exposure, driven by California fuel prices and the necessity of vehicle ownership for most households. Groceries and utilities are elevated but not extreme. The cost structure is less about high prices across the board and more about the weight of two dominant categories: housing and transportation.
How this article was built: In addition to public economic data, this article incorporates location-based experiential signals derived from anonymized geographic patterns—such as access density, walkability, and land-use mix—to reflect how day-to-day living actually feels in Fountain Valley, CA.
—