Lower housing entry in Florissant. Higher electricity rates in St. Louis. More car dependence in one, more transit friction in the other. Both cities sit in the same metro, share the same grocery chains, and face the same Missouri weather—but the cost experience diverges sharply depending on what your household prioritizes in 2026.
Florissant offers suburban space, strong family infrastructure, and lower barriers to homeownership, but demands a car for nearly everything. St. Louis provides more urban density and transit options, but housing pressure and utility costs behave differently. The decision isn’t about which city costs less overall—it’s about which cost structure aligns with how your household actually lives, works, and moves through daily routines.
This comparison explains where cost pressure concentrates in each city, which households feel those differences most, and how the same income can produce very different financial experiences depending on whether you’re navigating Florissant’s car-oriented corridors or St. Louis’s more walkable pockets.
Housing Costs
Florissant’s median home value sits at $125,200, creating a lower entry barrier for buyers seeking single-family homes with yards. Median gross rent runs $1,195 per month, reflecting a market dominated by standalone houses rather than apartment complexes. Housing pressure in Florissant shows up as ongoing costs—maintenance, property taxes, utilities for larger square footage—rather than upfront affordability barriers. Families prioritizing space over walkability find the housing entry point manageable, but the cost structure assumes car ownership and longer commutes.
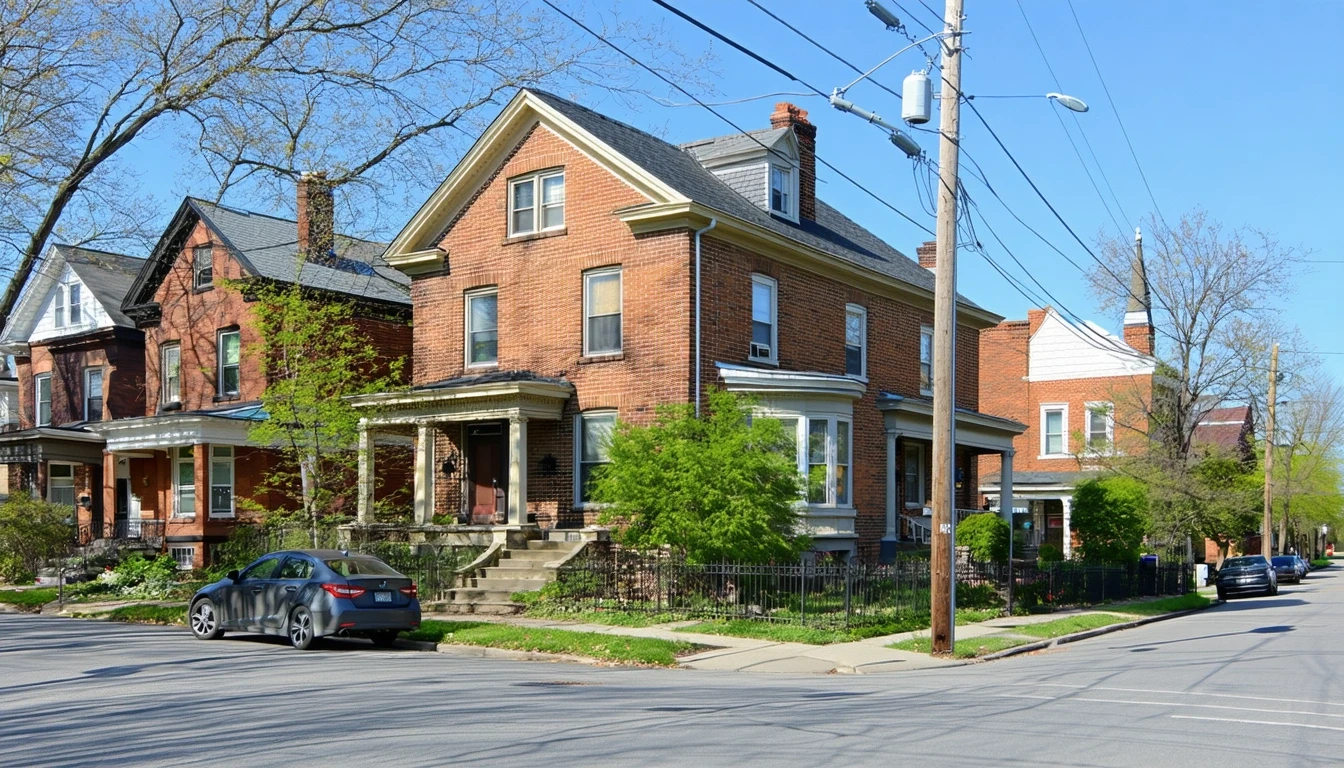
St. Louis housing data varies widely by neighborhood, with urban core options offering apartments and rowhouses alongside single-family stock in outer wards. Housing pressure in St. Louis tends to concentrate in availability and competition for units near transit or walkable commercial corridors. Renters sensitive to location convenience face tighter inventory, while buyers encounter more variability in property taxes and special assessments depending on ward and historic district status. The housing stock itself is older on average, which can introduce deferred maintenance exposure that newer suburban construction in Florissant avoids.
The structural difference: Florissant housing costs are more predictable but assume car dependence and larger utility footprints. St. Louis housing offers more flexibility in form and location but introduces variability in taxes, fees, and ongoing upkeep depending on neighborhood age and density.
| Housing Type | Florissant | St. Louis |
|---|---|---|
| Median home value | $125,200 | Varies by ward and neighborhood |
| Median gross rent | $1,195/month | Varies by unit type and location |
| Dominant housing form | Single-family detached | Mixed: apartments, rowhouses, single-family |
| Primary housing pressure | Ongoing costs (utilities, maintenance) | Availability near transit, property tax variability |
First-time buyers prioritizing entry cost and space will find Florissant more straightforward, but must budget for car ownership and longer commutes. Renters seeking walkable neighborhoods or transit access will find more options in St. Louis, but face tighter competition and less predictable fee structures. Families with school-age children benefit from Florissant’s strong family infrastructure and newer housing stock, while urban-oriented households prioritizing convenience over square footage may prefer St. Louis’s mixed-use corridors.
Housing takeaway: Florissant favors households willing to trade walkability for space and lower entry costs. St. Louis favors households prioritizing location flexibility and transit access over predictable ongoing expenses. The primary difference is not price—it’s whether housing pressure shows up as front-loaded entry barriers or as ongoing variability in taxes, fees, and maintenance exposure.
Utilities and Energy Costs
Florissant’s electricity rate sits at 12.95¢/kWh, while St. Louis runs 15.84¢/kWh—a meaningful gap that compounds over months of cooling and heating. Both cities face hot, humid summers and cold winters, but the cost exposure differs based on housing form. Florissant’s single-family homes carry larger square footage and more exterior wall exposure, driving higher baseline usage even at lower rates. St. Louis apartments and rowhouses offer smaller footprints and shared walls, reducing total consumption but paying higher per-unit costs.
Natural gas pricing in St. Louis stands at $33.01/MCF, reflecting heating season exposure for homes relying on gas furnaces. Florissant’s natural gas price sits at $28.51/MCF, offering slightly lower heating costs but still subject to winter volatility. Older housing stock in St. Louis introduces more insulation variability—historic homes without updated windows or attic insulation experience sharper seasonal swings, while newer construction in Florissant provides more predictable baseline usage.
Utility cost exposure in Florissant concentrates in summer cooling, driven by larger homes and suburban heat island effects. Households with older HVAC systems or minimal shade coverage face sustained high usage from June through September. St. Louis households experience more predictable cooling costs due to smaller unit sizes, but higher electricity rates mean less room for error—running AC continuously or neglecting thermostat discipline produces steeper bills. Heating season affects both cities similarly, but St. Louis’s older housing stock introduces more variability in how much gas individual homes actually consume.
Single adults in small apartments will feel utility pressure more acutely in St. Louis due to higher electricity rates, even with lower total usage. Families in larger Florissant homes face higher absolute bills but benefit from lower per-kWh costs, making efficiency upgrades (programmable thermostats, LED lighting, attic insulation) more impactful. Dual-income couples in newer construction experience the most predictable utility costs in Florissant, while those in older St. Louis rowhouses face more seasonal volatility and less control over baseline consumption.
Utility takeaway: Florissant households experience higher total usage but lower rates, making efficiency upgrades more rewarding. St. Louis households face higher rates but smaller footprints, making behavioral changes (thermostat discipline, off-peak usage) more critical. The primary difference is whether utility pressure shows up as higher baseline consumption or as higher per-unit costs with less flexibility.
Groceries and Daily Expenses
Both Florissant and St. Louis share the same regional grocery pricing, with cost indices at 96% of the national average. Bread runs around $1.72/lb in Florissant and $1.79/lb in St. Louis, while ground beef sits at $6.28/lb in Florissant and $6.07/lb in St. Louis—differences driven by store format and regional adjustment rather than fundamental market gaps. The real divergence shows up in how households access groceries and how convenience spending creeps into daily routines.
Florissant’s corridor-clustered grocery accessibility means most households drive to big-box stores or regional chains, consolidating trips and buying in bulk. This reduces per-item costs but assumes car ownership, trunk space, and time to plan weekly shopping. Convenience spending in Florissant concentrates in drive-thru coffee, fast-casual dining along commercial corridors, and gas station snacks during commutes. Families with meal-planning discipline benefit from bulk pricing and fewer impulse purchases, but households with irregular schedules face more friction—forgetting an item means another 15-minute drive.
St. Louis offers more walkable grocery access in certain neighborhoods, with corner stores, smaller-format grocers, and urban markets providing fill-in options without a car. This reduces planning burden but often comes with higher per-item pricing and less bulk discount availability. Convenience spending in St. Louis shows up differently—more frequent coffee shop visits, more takeout from walkable restaurants, more small purchases that add up over the month. Single adults and couples without kids benefit from the flexibility, while larger families managing higher grocery volumes may find the lack of bulk options and higher per-trip costs more burdensome.
Price sensitivity matters more in Florissant for households that can’t or won’t drive frequently—those relying on bus service face longer trip times and less flexibility to chase sales. In St. Louis, price sensitivity shows up in the trade-off between convenience and cost—walkable access reduces transportation friction but often means paying more per item or skipping bulk discounts entirely.
Grocery takeaway: Florissant favors households with cars, storage space, and meal-planning routines that benefit from bulk pricing. St. Louis favors households prioritizing walkable access and flexibility over per-item cost optimization. The primary difference is whether grocery pressure shows up as transportation friction or as higher per-item costs for convenience.
Taxes and Fees
Property taxes in Florissant and St. Louis both reflect Missouri’s county-level assessment structure, but the effective burden differs based on home value, ward location, and special district fees. Florissant homeowners face relatively predictable property tax bills tied to lower median home values, while St. Louis property taxes vary more widely depending on whether the home sits in a historic district, special taxing zone, or area with recent reassessment activity. Sales tax rates in both cities hover in the same range, but St. Louis adds more granular local option taxes depending on neighborhood and commercial district.
Recurring fees introduce another layer of variability. Florissant households in newer subdivisions may encounter HOA fees bundling landscaping, trash, or shared amenities, while older neighborhoods typically handle these services individually. St. Louis renters and homeowners face more fragmented fee structures—trash billed separately, water and sewer as distinct line items, and occasional special assessments for infrastructure projects in older wards. These fees are rarely large individually, but they accumulate and vary unpredictably across neighborhoods.
Homeowners planning to stay long-term in Florissant benefit from more stable property tax trajectories, assuming home values appreciate gradually without sharp reassessments. St. Louis homeowners face more volatility—rapid neighborhood gentrification or infrastructure investment can trigger reassessments that shift tax burdens quickly. Renters in both cities see these costs indirectly, but St. Louis renters in older buildings may experience more pass-through fee increases as landlords manage aging infrastructure.
Tax and fee takeaway: Florissant offers more predictable property tax exposure tied to lower home values, with occasional HOA fees in newer areas. St. Louis introduces more variability in property taxes and fragmented fee structures, especially in older or rapidly changing neighborhoods. The primary difference is whether tax pressure shows up as stable and predictable or as variable and tied to neighborhood-specific factors.
Transportation & Commute Reality
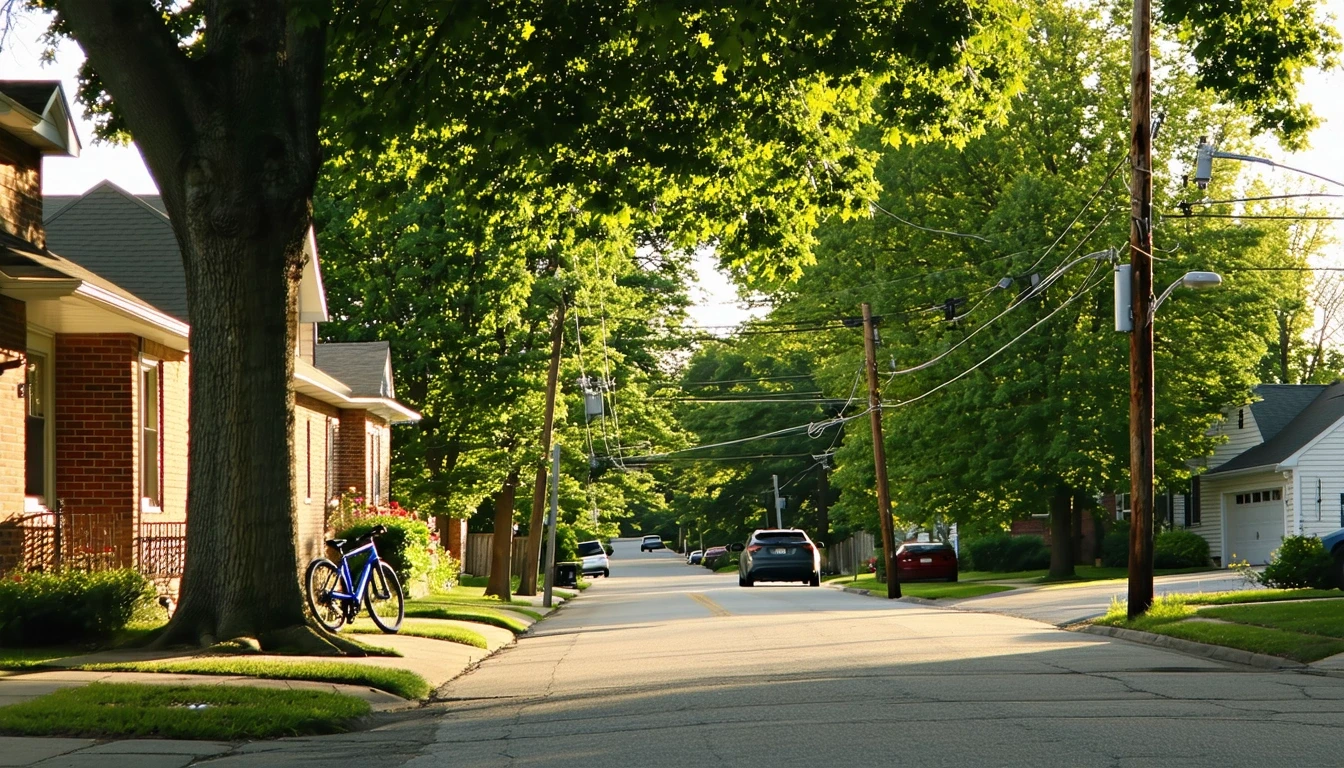
Florissant operates as a car-oriented suburb with pedestrian infrastructure below low thresholds and bike-to-road ratios in the lower range. Bus service exists, but the network assumes most households drive for work, errands, and daily logistics. Gas prices in Florissant sit at $2.41/gal, lower than St. Louis’s $2.71/gal, but the real cost driver is how often households must drive and how far. Commutes from Florissant to St. Louis employment centers or other metro destinations require car ownership—transit options exist but add significant time and transfer friction.
St. Louis offers more transit infrastructure, including bus routes and rail options in certain corridors, but coverage remains uneven. Households living near transit hubs or in walkable neighborhoods can reduce car dependence for some trips, but most still own vehicles for flexibility. Gas prices run higher, and parking costs in denser areas add another layer of expense. The trade-off: St. Louis households near transit can skip some car trips entirely, reducing wear, insurance exposure, and fuel costs, but only if their daily routines align with available routes.
Commute time matters as much as commute cost. Florissant households driving to St. Louis for work face predictable highway routes but limited alternatives if traffic disrupts the pattern. St. Louis households working downtown or in walkable districts can use transit or bike infrastructure, reducing time behind the wheel but often extending total trip duration. Households with flexible schedules or remote work arrangements feel less pressure in either city, while those commuting daily to fixed locations experience the structural differences more acutely.
Transportation takeaway: Florissant assumes car ownership and rewards households with predictable commute routes and lower gas prices. St. Louis offers more transit flexibility but only for households whose routines align with available service. The primary difference is whether transportation pressure shows up as mandatory car dependence or as time-versus-money trade-offs in transit planning.
Cost Structure Comparison
Housing dominates the cost experience in Florissant, with lower entry barriers but higher ongoing obligations tied to space, maintenance, and utility footprints. St. Louis shifts housing pressure toward availability and location—households pay for walkability and transit access through tighter competition, older housing stock, and more variable fee structures. Neither city offers a universal housing advantage; the fit depends on whether a household prioritizes space and predictability or location flexibility and reduced car dependence.
Utilities introduce more volatility in St. Louis due to higher electricity rates and older housing stock, even though smaller unit sizes reduce total consumption. Florissant households face higher baseline usage but benefit from lower per-kWh costs, making efficiency upgrades more impactful. Households sensitive to seasonal bill swings will feel more pressure in St. Louis, while those managing larger homes in Florissant must budget for sustained high usage during summer cooling months.
Groceries and daily expenses behave similarly in both cities at the per-item level, but access patterns differ sharply. Florissant rewards bulk shopping and meal planning but assumes car ownership and time to consolidate trips. St. Louis offers more walkable access and fill-in convenience but often at higher per-item costs and without bulk discount availability. Households with irregular schedules or limited storage benefit from St. Louis’s flexibility, while larger families managing higher grocery volumes find Florissant’s big-box access more cost-effective.
Transportation patterns matter more in Florissant, where car dependence is non-negotiable and gas, insurance, and maintenance costs accumulate as fixed obligations. St. Louis offers more transit flexibility, but only for households whose routines align with available service—most still own cars for backup, reducing the cost advantage. Households commuting daily to fixed locations experience the structural differences most acutely, while remote workers or those with flexible schedules face less pressure in either city.
The decision is not about which city costs less—it’s about which cost structure aligns with how a household actually lives. Households sensitive to housing entry costs and willing to drive for everything may prefer Florissant. Households prioritizing walkability, transit access, and location flexibility may prefer St. Louis, even with higher utility rates and less predictable fee structures. For households managing tight budgets, the difference is less about total spending and more about where financial pressure concentrates and how much control they have over it.
How the Same Income Feels in Florissant vs St. Louis
Single Adult
Housing becomes the first non-negotiable cost, with Florissant offering lower rent for more space but requiring a car for all errands. St. Louis allows some households to skip car ownership entirely if they live near transit and walkable grocery options, but rent in those neighborhoods often runs higher. Flexibility exists in grocery spending and convenience purchases, but Florissant households must budget for gas and car maintenance as fixed costs. St. Louis singles near transit hubs experience more day-to-day flexibility but less control over utility bills in older apartments. The role of commute friction matters most—Florissant singles driving daily face predictable but unavoidable transportation costs, while St. Louis singles using transit trade time for lower car dependence.
Dual-Income Couple
Housing and transportation become tightly linked non-negotiables, with Florissant couples benefiting from lower home prices but requiring two cars if both partners commute. St. Louis couples near transit corridors can sometimes manage with one vehicle, reducing insurance and maintenance exposure. Flexibility exists in dining out and convenience spending, but Florissant couples must plan grocery trips more deliberately to avoid frequent drive-time costs. Utility bills in St. Louis introduce more seasonal volatility, especially in older rowhouses, while Florissant couples in newer construction experience more predictable baseline costs. The role of commute friction and car dependence determines how much income remains flexible—Florissant couples driving separately face higher fixed transportation costs, while St. Louis couples sharing one car or using transit preserve more discretionary income.
Family with Kids
Housing, transportation, and childcare infrastructure become non-negotiable, with Florissant offering stronger family amenities, lower home prices, and more space but requiring two cars for school, activities, and errands. St. Louis families face tighter housing competition in walkable neighborhoods with good schools, and older housing stock introduces more maintenance and utility unpredictability. Flexibility disappears in grocery spending—larger volumes demand bulk shopping, which Florissant’s big-box access supports better than St. Louis’s walkable but higher-priced options. The role of commute friction and time budget becomes critical—Florissant families driving kids to activities and managing suburban logistics face higher transportation costs but more predictable routines, while St. Louis families in walkable neighborhoods reduce car dependence but navigate more fragmented errands and less consistent transit coverage for non-work trips.
Decision Matrix: Which City Fits Which Household?
| Decision factor | If you’re sensitive to this… | Florissant tends to fit when… | St. Louis tends to fit when… |
|---|---|---|---|
| Housing entry + space needs | You prioritize lower upfront costs and more square footage over walkability | You value predictable entry costs and single-family home access | You prioritize location flexibility and accept higher variability in fees and taxes |
| Transportation dependence + commute friction | You need flexibility to skip car trips or reduce driving frequency | You accept car dependence and benefit from lower gas prices and highway access | Your daily routine aligns with transit routes and you value walkable errands |
| Utility variability + home size exposure | You want predictable seasonal bills and control over baseline usage | You manage a larger home but benefit from lower per-kWh electricity rates | You live in a smaller unit and can absorb higher rates through reduced total consumption |
| Grocery strategy + convenience spending creep | You plan meals in advance and benefit from bulk pricing | You have car access, storage space, and time to consolidate shopping trips | You value walkable fill-in access and accept higher per-item costs for convenience |
| Fees + friction costs (HOA, services, upkeep) | You want predictable recurring costs without surprise assessments | You prefer newer housing with bundled services and stable property tax trajectories | You accept fragmented fee structures and variability tied to neighborhood age and infrastructure |
| Time budget (schedule flexibility, errands, logistics) | You need to minimize trip planning and maximize errand efficiency | You drive for all errands and benefit from consolidated big-box shopping | You value walkable access that reduces planning burden even if trips take longer |
Lifestyle Fit
Florissant operates as a family-oriented suburb with strong infrastructure for households with school-age children—school density and playground availability both meet medium thresholds, and park access exceeds high density benchmarks. Daily life assumes car ownership, with most errands, activities, and social routines requiring a drive. Walkability exists in pockets, but pedestrian infrastructure remains below low thresholds relative to road networks. Households prioritizing yard space, newer construction, and predictable suburban routines find Florissant’s layout intuitive, but those seeking spontaneous walkable errands or frequent transit use will feel the structural friction.
St. Louis offers more lifestyle variability depending on neighborhood, with walkable commercial corridors, historic districts, and mixed-use areas providing more pedestrian-friendly routines in certain wards. Cultural amenities, dining options, and entertainment venues concentrate in denser areas, reducing the need to drive for evening or weekend activities. Outdoor recreation exists throughout the metro, but access depends more on proximity to specific parks or trails rather than the integrated green space availability Florissant offers. Households valuing spontaneity, walkable errands, and urban texture find more alignment in St. Louis, while those prioritizing space, quiet, and family-oriented infrastructure may feel the trade-offs more acutely.
Commute times shape daily lifestyle more than raw distance. Florissant households driving to St. Louis employment centers face predictable highway routes but limited flexibility if schedules shift. St. Louis households working downtown or in walkable districts can bike, walk, or use transit for some trips, reducing time behind the wheel but often extending total trip duration. Remote workers and flexible-schedule households experience less lifestyle pressure in either city, while those commuting daily to fixed locations feel the structural differences in transportation dependence and time budget more sharply.
Florissant unemployment rate: 3.6%
St. Louis unemployment rate: 4.1%
Frequently Asked Questions
Is Florissant or St. Louis cheaper for renters in 2026?
Florissant offers lower median rent at $1,195 per month, but assumes car ownership for all errands and commutes, adding transportation costs. St. Louis rent varies widely by neighborhood, with walkable areas near transit running higher but allowing some households to reduce or eliminate car dependence. The cheaper option depends on whether a household prioritizes lower base rent or reduced transportation obligations.
Which city has lower utility bills, Florissant or St. Louis?
Florissant has lower electricity rates at 12.95¢/kWh compared to St. Louis’s 15.84¢/kWh, but larger single-family homes in Florissant often consume more total energy. St. Louis households in smaller apartments or rowhouses pay higher per-kWh rates but use less overall. The lower utility burden depends on housing size, insulation quality, and seasonal usage patterns rather than rates alone.
Does living in Florissant require owning a car compared to St. Louis?
Yes, Florissant’s car-oriented layout and limited pedestrian infrastructure make car ownership effectively mandatory for work, errands, and daily logistics. St. Louis offers more transit options and walkable neighborhoods, allowing some households to reduce car dependence, but most still own vehicles for flexibility. The difference is whether car ownership is non-negotiable or optional depending on routine and location.
How do grocery costs compare between Florissant and St. Louis in 2026?
Per-item grocery prices remain similar in both cities, with regional cost indices around 96% of the national average. The difference shows up in access—Florissant households drive to big-box stores for bulk pricing, while St. Louis offers more walkable grocery options at higher per-item costs. Households managing larger grocery volumes benefit from Florissant’s bulk access, while smaller households prioritizing convenience may prefer St. Louis’s walkable fill-in options.
Which city is better for families with kids, Florissant or St. Louis?
Florissant offers stronger family infrastructure with higher school and playground density, lower housing entry costs, and more single-family home availability. St. Louis provides more neighborhood variability, with some areas offering walkable schools and parks but less consistent family amenities across wards. Families prioritizing space, predictability, and car-based logistics fit better in Florissant, while those valuing walkable routines and urban texture may find alignment in specific St. Louis neighborhoods.
Conclusion
Florissant and St. Louis sit in the same metro but produce different cost experiences depending on how a household moves, shops, and manages daily logistics. Florissant offers lower housing entry costs, predictable suburban infrastructure, and strong family amenities, but assumes car ownership and rewards households willing to drive for everything. St. Louis provides more transit flexibility, walkable neighborhood options, and lifestyle variability, but introduces higher utility rates, more fragmented fee structures, and tighter housing competition in desirable areas.
The decision is not about which city costs less overall—it’s about which cost structure aligns with a household’s priorities and routines. Households sensitive to housing entry barriers and comfortable with car dependence will find Florissant more straightforward. Households prioritizing walkability, transit access, and location flexibility will find more alignment in St. Louis, even with higher per-unit utility costs and less predictable fee exposure. Both cities offer trade-offs; the better fit depends on which costs a household can control and which pressures they’re willing to absorb.
How this article was built: In addition to public economic data, this article incorporates location-based experiential signals derived from anonymized geographic patterns—such as access density, walkability, and land-use mix—to reflect how day-to-day living actually feels in Florissant, MO.