Eastvale vs Riverside, 2026: Housing entry in Eastvale runs $676,500 median home value and $2,965 median rent. Riverside: $485,500 and $1,711. Electricity slightly cheaper in Eastvale (31.91¢/kWh vs 33.60¢/kWh). Gas more expensive in Eastvale ($4.61/gal vs $4.25/gal). Median household income in Eastvale: $151,615. Riverside: $83,448. Both cities: 5.3% unemployment, same regional price parity. Riverside commute averages 31 minutes; 46.4% face long commutes. Eastvale commute data unavailable but infrastructure signals show walkable pockets, corridor-clustered groceries, and integrated park access. The decision hinges on whether your household prioritizes lower housing entry costs or newer infrastructure with higher income baselines.
Both cities sit in the Inland Empire, sharing the same regional cost baseline and similar climate exposure. Yet cost structure diverges sharply: Eastvale concentrates pressure at the housing entry point but offers predictability and amenity density once you’re in. Riverside spreads cost exposure across housing, commute time, and older infrastructure but opens the door to households earning less. Neither city is universally cheaper—the better fit depends entirely on which costs dominate your household’s decision in 2026.
This comparison explains where cost pressure shows up differently, how housing and transportation tradeoffs interact, and which household types feel those differences most acutely. It does not calculate total affordability or declare a winner.
Housing Costs
Eastvale’s median home value of $676,500 and median gross rent of $2,965 per month create a steep entry barrier. Riverside’s $485,500 median home value and $1,711 median rent lower that threshold substantially. The difference isn’t just magnitude—it’s what kind of housing pressure dominates once you’re past the entry point.
In Eastvale, housing stock skews newer, with more single-family homes built in the past two decades. That translates to lower ongoing maintenance volatility and more predictable utility exposure due to modern insulation and HVAC systems. Riverside’s housing mix includes older single-family homes, apartments, and duplexes, offering more rental variety but introducing higher maintenance unpredictability for owners and age-related utility inefficiency for renters in older buildings.
For renters, the $1,254 monthly difference between Eastvale and Riverside represents the largest single cost gap in this comparison. Renters in Eastvale face higher baseline obligations but gain access to newer construction, integrated park systems, and corridor-clustered grocery options. Renters in Riverside trade lower monthly rent for older building stock, longer average commutes, and more variability in neighborhood walkability.
| Housing Type | Eastvale | Riverside |
|---|---|---|
| Median Home Value | $676,500 | $485,500 |
| Median Gross Rent | $2,965/month | $1,711/month |
| Typical Housing Stock | Newer single-family, planned communities | Mixed-age single-family, apartments, duplexes |
First-time buyers in Eastvale need substantially higher down payment reserves and must qualify for larger loan amounts, but they enter a market with less deferred maintenance risk. First-time buyers in Riverside face lower entry costs but inherit more age-related repair exposure, particularly in homes built before 2000. Families prioritizing space and newer infrastructure lean toward Eastvale if income supports the entry barrier; families prioritizing lower monthly obligations and tolerance for older housing stock find more flexibility in Riverside.
Housing takeaway: Eastvale front-loads cost pressure at entry but reduces ongoing volatility. Riverside lowers the entry barrier but increases maintenance and age-related exposure. Households with higher incomes and lower tolerance for repair unpredictability fit Eastvale’s structure; households prioritizing lower baseline obligations and comfort with older housing stock fit Riverside’s tradeoffs.
Utilities and Energy Costs
Electricity rates differ slightly: Eastvale at 31.91¢/kWh, Riverside at 33.60¢/kWh. Natural gas pricing is nearly identical (Eastvale $21.89/MCF, Riverside $21.94/MCF). Both cities experience hot, dry summers driving extended cooling seasons and mild winters with minimal heating demand. The primary difference in utility exposure comes from housing age and building efficiency, not rate structure.
Eastvale’s newer housing stock typically includes better insulation, dual-pane windows, and more efficient HVAC systems, reducing cooling load intensity during triple-digit summer heat. Riverside’s older housing stock—particularly homes built in the 1970s through 1990s—often lacks modern efficiency features, increasing baseline electricity consumption during peak summer months even at a slightly higher rate. The combination of older construction and higher per-kWh cost concentrates utility volatility in Riverside, especially for single-family homeowners in pre-2000 builds.
Apartment renters in both cities experience lower absolute utility costs due to smaller square footage, but those in Riverside face more variability depending on building age and whether landlords have upgraded windows, insulation, or cooling systems. Renters in Eastvale’s newer apartment complexes benefit from construction standards that reduce cooling inefficiency, making summer bills more predictable even during extreme heat.
Households in larger single-family homes feel utility exposure most acutely. In Eastvale, a 2,500-square-foot home built after 2010 experiences lower cooling costs than a similarly sized home in Riverside built in 1985, even accounting for the small rate difference. Families managing larger spaces should factor housing age into utility predictability, not just rate comparisons. Older homes in Riverside also introduce higher risk of HVAC system failure, adding repair volatility on top of usage costs.
Utility takeaway: Eastvale’s lower electricity rate and newer housing stock reduce cooling volatility. Riverside’s slightly higher rate and older building stock increase summer utility exposure, particularly for single-family homeowners. Households prioritizing predictable energy costs and lower maintenance risk fit Eastvale’s structure; households comfortable managing older systems and seasonal spikes fit Riverside’s tradeoffs.
Groceries and Daily Expenses
Both cities share the same regional price parity index (100), meaning grocery staples, household goods, and everyday spending face similar baseline pricing. The difference lies in how access patterns and infrastructure shape convenience spending and trip frequency.
Eastvale’s corridor-clustered grocery infrastructure concentrates supermarkets and big-box stores along main thoroughfares, reducing trip distance for households near those corridors but requiring more intentional planning for those in residential pockets. Riverside’s more established commercial grid spreads grocery options across neighborhoods, offering more walkable access in older areas but less concentration of discount chains. Households prioritizing bulk shopping and big-box access may find Eastvale’s layout more efficient; households valuing neighborhood-scale grocery stores and shorter trips on foot may prefer Riverside’s older commercial fabric.
Dining out and convenience spending pressure differs by lifestyle fit, not price level. Eastvale’s newer development includes chain restaurants and fast-casual options clustered near retail centers, making takeout accessible but car-dependent. Riverside’s older commercial districts include more independent restaurants, cafes, and walkable dining options in established neighborhoods, reducing the need to drive for every meal out. Single adults and couples who dine out frequently may experience lower friction costs in Riverside due to proximity; families managing larger grocery volumes may find Eastvale’s big-box concentration more efficient for weekly shopping runs.
Prepared foods, coffee runs, and impulse convenience spending add up differently depending on commute patterns and daily routines. Riverside’s longer average commute (31 minutes) and higher percentage of long commuters (46.4%) increase exposure to drive-through stops, gas station snacks, and convenience store markups. Eastvale’s infrastructure supports more predictable shopping routines with fewer daily friction points, reducing unplanned spending for households that batch errands efficiently.
Grocery takeaway: Eastvale’s corridor-clustered layout favors bulk shopping and big-box efficiency but requires car trips. Riverside’s neighborhood-scale commercial fabric supports walkable errands and reduces convenience spending friction for shorter trips. Families managing larger volumes fit Eastvale’s structure; single adults and couples prioritizing walkability and dining variety fit Riverside’s older grid.
Taxes and Fees
Both cities fall under California’s state tax structure, including the same sales tax framework and property tax baseline (approximately 1% of assessed value plus local bonds and assessments). The difference in tax exposure comes from housing value, not rate structure. Eastvale’s higher median home value of $676,500 generates higher annual property tax obligations than Riverside’s $485,500 median, even at identical rates.
Homeowners in Eastvale pay more in absolute property tax dollars due to higher assessed values, but they also benefit from newer infrastructure that reduces special assessment risk. Riverside homeowners pay lower baseline property taxes but face higher exposure to aging infrastructure bonds, street repair assessments, and utility system upgrades in older neighborhoods. The tradeoff is predictability versus magnitude: Eastvale front-loads tax obligations through higher home values, while Riverside introduces more variability through aging infrastructure costs.
HOA fees appear more frequently in Eastvale due to planned community development, often bundling landscaping, park maintenance, and shared amenities. Riverside’s older housing stock includes fewer HOA-governed neighborhoods, reducing recurring fees but shifting maintenance responsibility entirely to individual homeowners. Households prioritizing predictable monthly obligations and outsourced landscaping fit Eastvale’s HOA structure; households preferring control over maintenance timing and lower recurring fees fit Riverside’s older ownership model.
Renters in both cities avoid direct property tax exposure but absorb it indirectly through rent levels. Eastvale’s higher rent reflects higher property taxes and newer construction costs; Riverside’s lower rent reflects lower property taxes but also older building stock and deferred maintenance. Renters planning to stay several years should weigh whether Eastvale’s higher baseline rent buys predictability or whether Riverside’s lower rent justifies tolerance for older infrastructure.
Taxes and fees takeaway: Eastvale’s higher home values generate higher property tax obligations but reduce special assessment risk. Riverside’s lower home values reduce baseline taxes but increase exposure to aging infrastructure costs. Homeowners prioritizing predictability fit Eastvale; homeowners prioritizing lower baseline obligations and control over maintenance timing fit Riverside.
Transportation & Commute Reality
Riverside’s documented commute patterns show a 31-minute average and 46.4% of workers facing long commutes, reflecting its role as a regional hub with established employment centers and older freeway access. Eastvale lacks published commute data, but its newer development and location between established job centers suggest shorter average trips for residents working locally, though longer trips for those commuting to Los Angeles or Orange County.
Gas prices differ slightly: Eastvale at $4.61/gallon, Riverside at $4.25/gallon. The $0.36 difference matters less than trip frequency and distance. Riverside’s higher percentage of long commuters increases total fuel exposure despite lower per-gallon cost. Eastvale’s newer residential layout and walkable pockets reduce short-trip car dependency for errands, lowering fuel consumption for households that batch shopping and recreation efficiently.
Transit infrastructure differs structurally. Riverside offers more established bus service and regional rail connections, making car-free or car-light living more viable for households near transit corridors. Eastvale’s bus-only service and newer development reduce transit viability, increasing car dependence for most households. Single adults and couples prioritizing lower transportation costs and tolerance for transit schedules fit Riverside’s infrastructure; families prioritizing car-based convenience and newer road networks fit Eastvale’s layout.
Commute time translates to hidden costs beyond fuel: vehicle wear, insurance risk from higher mileage, and time budget pressure. Riverside’s 31-minute average and high percentage of long commuters increase exposure to maintenance cycles, tire replacement, and brake wear. Eastvale’s lack of published commute data suggests more variability depending on employment location, but its walkable pockets and mixed land use reduce short-trip vehicle dependency for daily errands.
Cost Structure Comparison
Housing dominates the cost experience in both cities, but the pressure point differs. Eastvale concentrates cost at entry—higher down payments, higher rent, higher monthly mortgage obligations—but reduces ongoing volatility through newer construction and lower maintenance exposure. Riverside lowers the entry barrier substantially, opening access to households earning less, but introduces more variability through older housing stock, aging infrastructure, and repair unpredictability.
Utilities introduce more volatility in Riverside due to older building stock and slightly higher electricity rates, particularly for single-family homeowners in pre-2000 construction. Eastvale’s newer homes and lower electricity rate reduce cooling exposure, making summer bills more predictable. Households sensitive to seasonal utility swings and maintenance unpredictability experience less friction in Eastvale; households comfortable managing older systems and tolerating seasonal spikes gain lower baseline housing costs in Riverside.
Transportation patterns matter more in Riverside, where longer average commutes and higher percentages of long commuters increase fuel, maintenance, and time costs despite lower gas prices. Eastvale’s walkable pockets and corridor-clustered errands reduce short-trip car dependency, lowering fuel consumption for households that batch trips efficiently. Households prioritizing lower transportation friction and shorter commutes fit Eastvale’s layout; households tolerating longer commutes in exchange for lower housing entry costs fit Riverside’s tradeoffs.
Daily living and groceries follow similar pricing due to shared regional price parity, but access patterns differ. Eastvale’s big-box concentration favors bulk shopping efficiency; Riverside’s neighborhood-scale commercial fabric supports walkable errands and reduces convenience spending friction. Families managing larger grocery volumes fit Eastvale’s structure; single adults and couples prioritizing walkability and dining variety fit Riverside’s older grid.
The better choice depends entirely on which costs dominate your household. For higher-income households prioritizing predictability, newer infrastructure, and lower ongoing volatility, Eastvale’s front-loaded housing costs buy stability. For households prioritizing lower entry barriers, tolerance for older systems, and comfort with longer commutes, Riverside’s structure offers access at lower baseline obligations.
How the Same Income Feels in Eastvale vs Riverside
Single Adult
Housing becomes non-negotiable first in both cities, but the entry point differs sharply. In Eastvale, median rent of $2,965 consumes a larger share of gross income, leaving less flexibility for discretionary spending, savings, or emergency reserves. In Riverside, median rent of $1,711 reduces baseline housing pressure, freeing up more monthly flexibility for transportation, dining out, or building reserves. Commute friction matters more in Riverside, where longer average trips increase fuel and time costs, but lower rent offsets that exposure. Eastvale’s walkable pockets and corridor-clustered errands reduce short-trip car dependency, lowering transportation friction for single adults who batch errands efficiently. Predictability feels higher in Eastvale due to newer infrastructure; flexibility feels higher in Riverside due to lower baseline obligations.
Dual-Income Couple
Housing pressure remains the primary cost driver, but dual incomes shift the tradeoff from affordability to lifestyle fit. In Eastvale, higher rent or mortgage obligations consume more combined income, but couples gain access to newer construction, integrated park systems, and predictable utility costs. In Riverside, lower housing costs free up income for travel, dining out, or savings, but couples absorb more volatility from older housing stock and longer commutes. Transportation costs diverge based on employment location: couples commuting to separate job centers in Riverside face higher fuel and time exposure due to longer average trips, while couples working locally in Eastvale reduce transportation friction through shorter distances and walkable errands. The decision hinges on whether predictability and newer amenities justify higher baseline costs or whether lower housing obligations and tolerance for older systems create more financial flexibility.
Family with Kids
Housing space needs become non-negotiable, and the cost structure diverges sharply. In Eastvale, higher home values and rent levels concentrate pressure at entry, but families gain access to newer single-family homes, integrated park systems, and playground density that reduces recreation friction. In Riverside, lower home values and rent levels ease entry barriers, but families inherit older housing stock with higher maintenance exposure and fewer family-oriented amenities within walking distance. School access and playground density favor Eastvale based on available infrastructure signals, reducing logistics friction for families managing multiple children. Commute patterns matter more for dual-income families in Riverside, where longer average trips increase time budget pressure and reduce schedule flexibility. Grocery logistics favor Eastvale’s big-box concentration for families managing larger volumes, while Riverside’s neighborhood-scale commercial fabric supports shorter trips but requires more frequent stops. The tradeoff is front-loaded housing costs for predictability and family infrastructure versus lower entry barriers with higher ongoing volatility and logistics friction.
Decision Matrix: Which City Fits Which Household?
| Decision Factor | If You’re Sensitive to This… | Eastvale Tends to Fit When… | Riverside Tends to Fit When… |
|---|---|---|---|
| Housing entry + space needs | Down payment reserves, monthly mortgage or rent obligations, and tolerance for deferred maintenance | You prioritize newer construction, predictable ongoing costs, and lower maintenance exposure despite higher entry barriers | You prioritize lower entry costs, tolerance for older housing stock, and comfort with age-related repair exposure |
| Transportation dependence + commute friction | Fuel costs, vehicle wear, time budget pressure, and daily trip frequency | You work locally, batch errands efficiently, and value walkable pockets that reduce short-trip car dependency | You tolerate longer commutes, value established transit options, and prioritize lower housing costs over transportation friction |
| Utility variability + home size exposure | Seasonal cooling costs, HVAC efficiency, and unpredictability in summer bills | You prioritize newer construction with modern insulation, lower electricity rates, and predictable cooling costs | You tolerate older systems, manage seasonal utility spikes, and prioritize lower baseline housing obligations over energy efficiency |
| Grocery strategy + convenience spending creep | Trip frequency, bulk shopping efficiency, and walkability for daily errands | You manage larger grocery volumes, value big-box concentration, and batch shopping trips to reduce frequency | You prioritize neighborhood-scale stores, walkable errands, and dining variety over bulk shopping efficiency |
| Fees + friction costs (HOA, services, upkeep) | Recurring monthly obligations, landscaping responsibility, and special assessments | You value predictable HOA-bundled services, outsourced landscaping, and lower special assessment risk from newer infrastructure | You prefer control over maintenance timing, lower recurring fees, and tolerance for aging infrastructure costs |
| Time budget (schedule flexibility, errands, logistics) | Commute duration, errand batching, and household logistics complexity | You prioritize shorter trips, walkable pockets for errands, and integrated park access that reduces recreation logistics | You tolerate longer commutes, value neighborhood-scale commercial fabric, and prioritize lower housing costs over time friction |
Lifestyle Fit
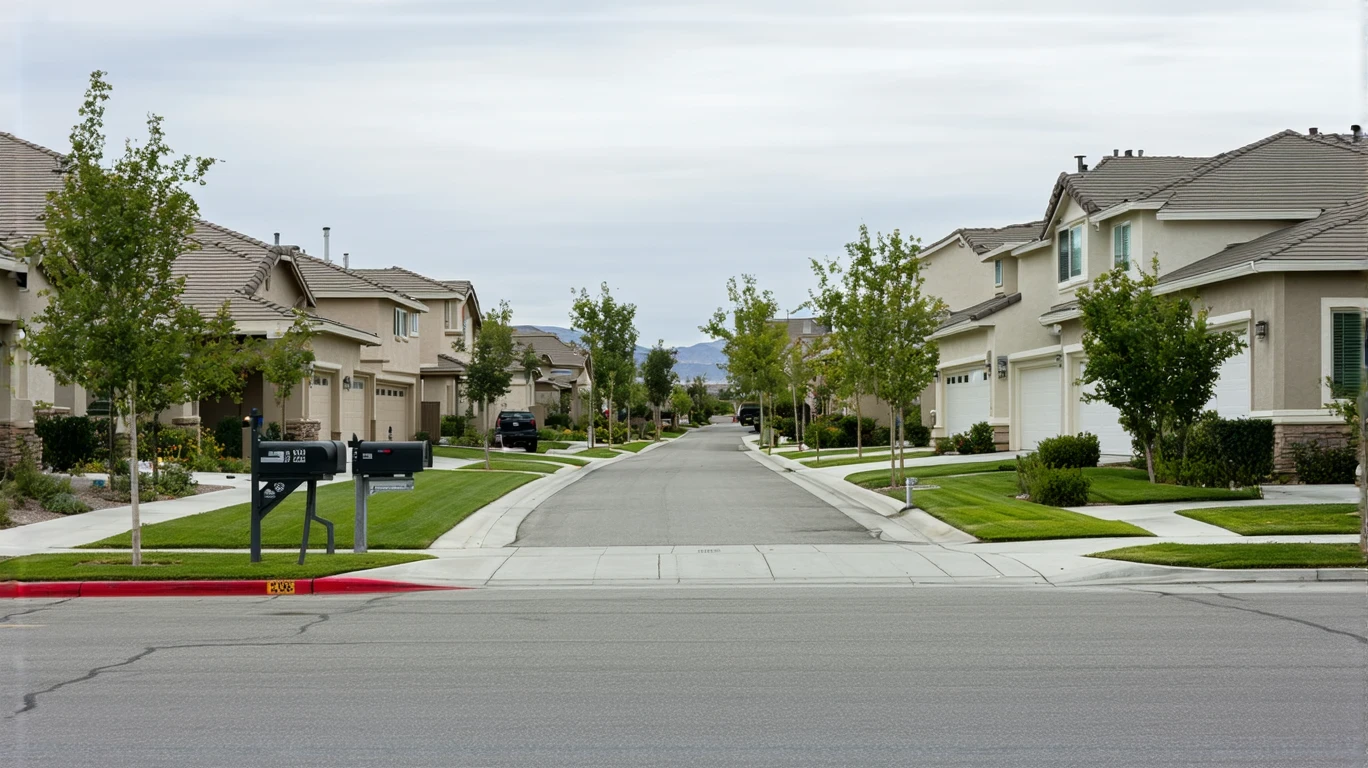
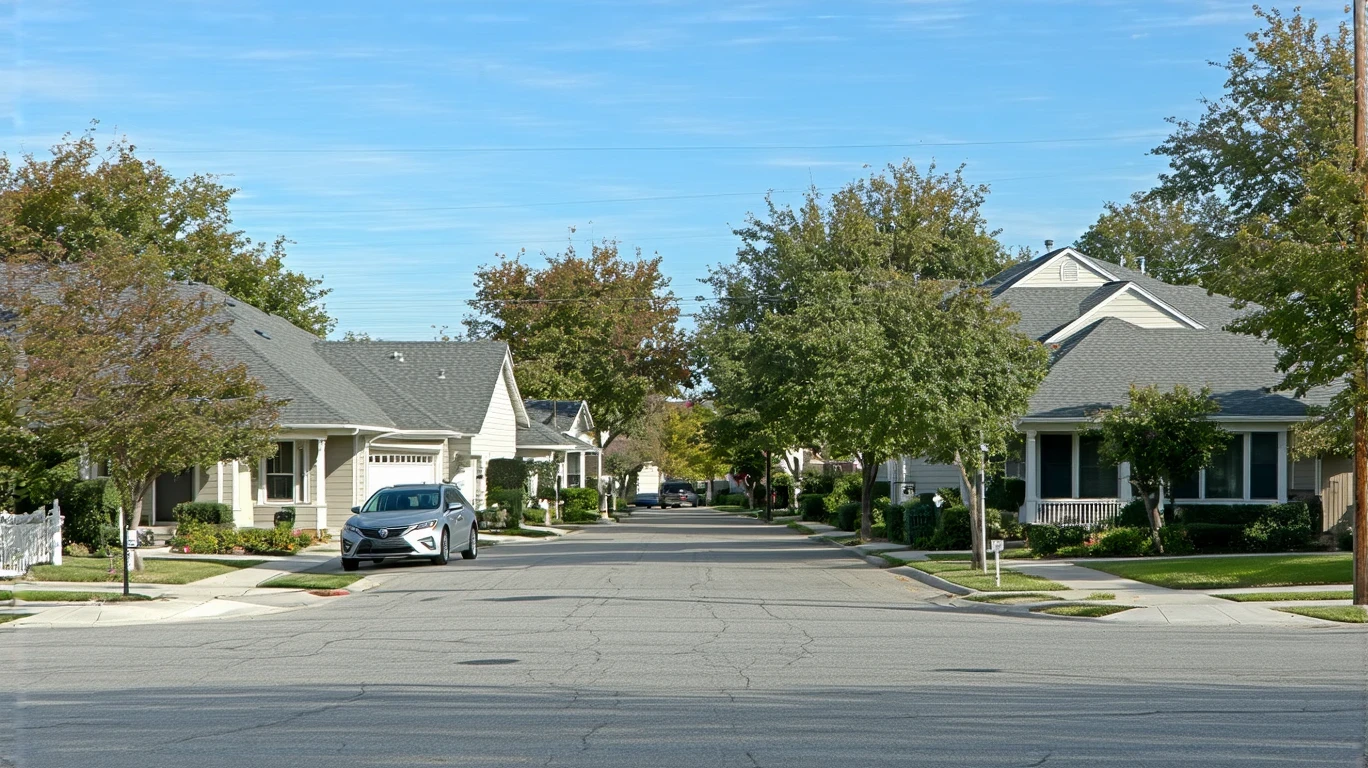
Eastvale’s newer development and planned community structure create a family-oriented environment with integrated park systems, playground density exceeding high thresholds, and walkable pockets that support short trips on foot. Riverside’s older commercial grid and established neighborhoods offer more dining variety, independent restaurants, and walkable access to neighborhood-scale stores, appealing to households prioritizing urban texture over planned amenities. Both cities experience hot, dry summers and mild winters, but Eastvale’s newer housing stock reduces cooling inefficiency while Riverside’s older construction increases seasonal utility exposure.
Commute patterns differ substantially: Riverside’s 31-minute average and 46.4% long commute percentage reflect its role as a regional hub with established employment centers, while Eastvale’s newer development and location between job centers suggest shorter local trips but longer commutes for those working in Los Angeles or Orange County. Households prioritizing shorter commutes and lower transportation friction fit Eastvale’s layout; households tolerating longer trips in exchange for lower housing entry costs fit Riverside’s structure.
Recreation and outdoor access favor Eastvale, where park density exceeds high thresholds and water features add visual appeal, reducing the need to drive for outdoor activities. Riverside’s older park system offers established green space but lower density, requiring more intentional planning for families managing multiple children. Healthcare access remains routine-local in Eastvale (clinics present, no hospital), while Riverside’s larger population and older infrastructure suggest more established medical facilities, though specific data wasn’t provided. Families prioritizing integrated park access and lower recreation logistics friction fit Eastvale; households comfortable with established neighborhoods and tolerance for older infrastructure fit Riverside.
Quick Facts: Eastvale’s mixed building character and land-use mix support both residential and commercial activity in walkable pockets. Riverside’s longer average commute and higher percentage of long commuters increase time budget pressure for dual-income households.
Frequently Asked Questions
Is Eastvale or Riverside cheaper for renters in 2026? Riverside’s median gross rent of $1,711 per month is substantially lower than Eastvale’s $2,965, reducing baseline housing pressure for renters. The difference represents the largest single cost gap in this comparison. Renters in Eastvale pay more but gain access to newer construction, integrated park systems, and corridor-clustered grocery options. Renters in Riverside trade lower monthly obligations for older building stock, longer average commutes, and more variability in neighborhood walkability. The better fit depends on whether lower baseline rent or newer infrastructure matters more to your household.
How do utility costs compare between Eastvale and Riverside in 2026? Electricity rates differ slightly: Eastvale at 31.91¢/kWh, Riverside at 33.60¢/kWh. Natural gas pricing is nearly identical. The primary difference in utility exposure comes from housing age, not rate structure. Eastvale’s newer housing stock reduces cooling inefficiency during hot summers, making bills more predictable. Riverside’s older construction increases seasonal utility volatility, particularly for single-family homeowners in pre-2000 builds. Households prioritizing predictable energy costs fit Eastvale’s structure; households comfortable managing older systems and seasonal spikes fit Riverside’s tradeoffs.
Which city is better for families with kids comparing Eastvale and Riverside in 2026? Eastvale’s integrated park systems, playground density exceeding high thresholds, and walkable pockets reduce recreation logistics friction for families managing multiple children. Riverside’s lower housing entry costs ease baseline financial pressure but introduce more maintenance exposure from older housing stock and fewer family-oriented amenities within walking distance. School density is lower in Eastvale based on available data, but playground infrastructure is stronger. Families prioritizing predictable costs and family infrastructure fit Eastvale despite higher entry barriers; families prioritizing lower baseline obligations and tolerance for older systems fit Riverside’s structure.
How do commute times affect cost differences between Eastvale and Riverside in 2026? Riverside’s documented 31-minute average commute and 46.4% long commute percentage increase fuel, vehicle wear, and time budget pressure despite lower gas prices ($4.25/gal vs Eastvale’s $4.61/gal). Eastvale lacks published commute data, but its walkable pockets and corridor-clustered errands reduce short-trip car dependency for daily logistics. Households working locally in Eastvale experience lower transportation friction; households tolerating longer commutes in Riverside gain lower housing entry costs but absorb higher transportation exposure. The tradeoff is time versus baseline housing obligations.
What income level do you need to live comfortably in Eastvale vs Riverside in 2026? Median household income in Eastvale is $151,615 per year; in Riverside, $83,448. The income gap reflects housing cost structure: Eastvale’s higher home values and rent levels require higher earnings to maintain similar financial flexibility, while Riverside’s lower entry barriers open access to households earning less. Comfort depends on which costs dominate your household—housing entry, transportation friction, or ongoing volatility. Higher-income households prioritizing predictability and newer infrastructure fit Eastvale; households prioritizing lower entry barriers and tolerance for older systems fit Riverside regardless of absolute income level.
Conclusion
Eastvale and Riverside sit in the same regional market, share the same price parity baseline, and face similar climate exposure, yet their cost structures diverge sharply. Eastvale front-loads pressure at the housing entry point—higher home values, higher rent, higher baseline obligations—but delivers predictability through newer construction, integrated park systems, and lower ongoing maintenance exposure. Riverside lowers the entry barrier substantially, opening access to households earning less, but introduces more volatility through older housing stock, longer average commutes, and aging infrastructure costs. Neither city is universally cheaper; the better fit depends entirely on which costs dominate your household’s decision in 2026.
Higher-income households prioritizing predictability, family infrastructure, and lower ongoing friction fit Eastvale’s structure despite steep entry costs. Households prioritizing lower baseline obligations, tolerance for older systems, and comfort with longer commutes fit Riverside’s tradeoffs. The decision is not about total affordability—it’s about where cost pressure shows up, how much control you have over it, and which household type you are. Both cities offer viable paths; the right choice depends on whether you prioritize stability at higher entry costs or flexibility at lower baselines with more variability.
How this article was built: In addition to public economic data, this article incorporates location-based experiential signals derived from anonymized geographic patterns—such as access density, walkability, and land-use mix—to reflect how day-to-day living actually feels in Eastvale, CA.