
Here’s the myth: Bloomington costs more across the board because it’s closer to Minneapolis-St. Paul’s urban core, while Brooklyn Park offers blanket savings as a quieter northwest suburb. The reality in 2026 is far more textured. Both cities sit in the same metro, share identical regional price levels, and face the same brutal Minnesota heating season. The meaningful differences aren’t about one city being universally cheaper—they’re about where cost pressure concentrates, which households feel it most, and how daily logistics either smooth out or amplify financial friction. Families chasing yard space face different tradeoffs than young professionals prioritizing commute time. Renters experience different volatility than first-time buyers stretching toward a down payment.
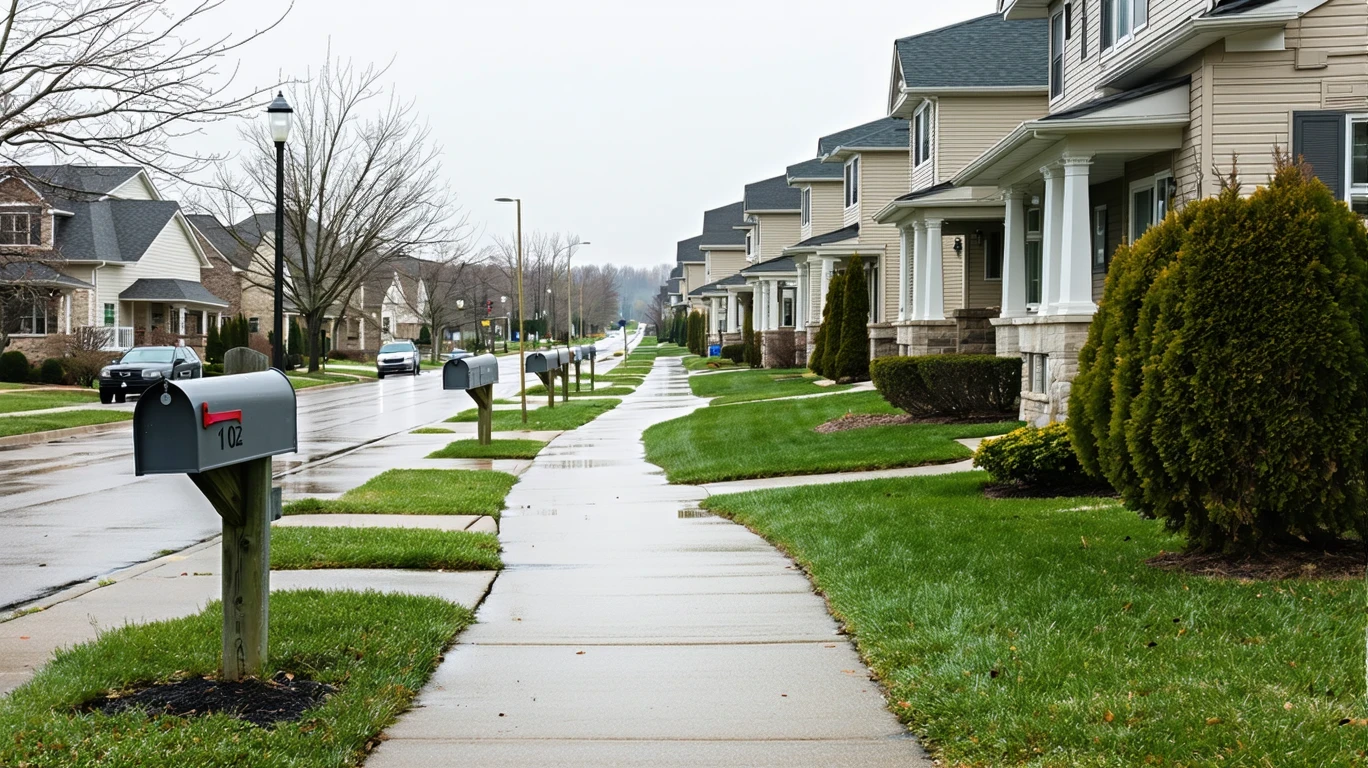
Brooklyn Park and Bloomington both function as established Twin Cities suburbs with strong park access, bus connectivity, and pockets of walkable infrastructure. Neither is a dense urban core, neither is isolated exurban sprawl. What separates them in 2026 is housing entry cost, building form, and the subtle ways those factors ripple into utilities, transportation habits, and household logistics. This comparison explains how the same household income feels different depending on which costs dominate your budget, which expenses you can control, and which you simply absorb. The better choice depends entirely on what your household can’t compromise on—and what you’re willing to manage.
Housing Costs: Where Entry Barriers Differ
Housing is where Brooklyn Park and Bloomington diverge most clearly. Brooklyn Park’s median home value sits at $289,400, while Bloomington’s reaches $327,100—a difference that translates directly into down payment requirements, monthly mortgage obligations, and property tax baselines. For renters, the gap is similarly structured: Brooklyn Park’s median gross rent is $1,244 per month, compared to Bloomington’s $1,426 per month. These aren’t small distinctions when a household is deciding whether to stretch into ownership or whether an extra $180 per month in rent crowds out other priorities.
The housing stock in each city also shapes cost predictability. Bloomington shows more vertical building character, meaning a higher concentration of multi-story apartment complexes and newer construction. That often correlates with better insulation, more efficient HVAC systems, and lower per-square-foot heating costs—but it also means less control over building-wide utility billing, stricter lease terms, and fewer opportunities to reduce costs through behavioral changes. Brooklyn Park’s mixed building profile includes more single-family homes and low-rise units, which offer more control over energy usage and maintenance timing but expose households to the full cost of aging systems, yard upkeep, and seasonal repairs. Renters in Brooklyn Park may find more variety in unit types and lease flexibility; renters in Bloomington may trade higher baseline costs for more predictable monthly obligations.
For first-time buyers, Brooklyn Park’s lower entry point matters enormously. A household saving for a down payment faces a smaller target, lower closing costs, and reduced mortgage insurance premiums. Bloomington’s higher home values demand more upfront capital and higher monthly carrying costs, even if the homes themselves are newer or closer to job centers. Families prioritizing space—extra bedrooms, a yard, room for kids to play—will find Brooklyn Park’s housing stock more accommodating at a given price point. Households prioritizing walkability to specific amenities, proximity to certain employers, or newer construction may justify Bloomington’s premium, but only if those factors directly reduce other costs (shorter commutes, lower utility bills, fewer car trips). The decision isn’t about which city is cheaper—it’s about which housing pressure your household can absorb and which tradeoffs you’re equipped to manage.
| Housing Type | Brooklyn Park | Bloomington |
|---|---|---|
| Median Home Value | $289,400 | $327,100 |
| Median Gross Rent | $1,244/month | $1,426/month |
| Typical Entry Barrier | Lower down payment, lower monthly mortgage | Higher down payment, higher monthly mortgage |
| Building Character | Mixed height, more single-family options | More vertical, newer multi-story construction |
Housing takeaway: Brooklyn Park offers lower entry costs for both renters and buyers, making it more accessible for households stretching budgets or prioritizing space. Bloomington’s higher housing costs may come with newer construction and more vertical density, which can reduce utility exposure but limits flexibility. First-time buyers and families sensitive to upfront costs will feel Brooklyn Park’s advantage most; households prioritizing newer buildings or specific location factors may justify Bloomington’s premium if it reduces other expenses.
Utilities and Energy Costs: Heating Dominates Both Cities
Utility costs in Brooklyn Park and Bloomington are shaped overwhelmingly by Minnesota’s long, severe heating season. Both cities face extended periods of below-freezing temperatures, high heating demand from November through March, and the same natural gas price of $9.99 per MCF. The primary difference lies in electricity rates: Brooklyn Park’s rate is 15.67¢/kWh, while Bloomington’s is slightly higher at 16.37¢/kWh. That gap matters most for households relying on electric heating, running high-draw appliances year-round, or living in poorly insulated older homes. For most households, though, natural gas heating costs dwarf electricity expenses during winter months, and the structural similarity between the two cities means utility volatility follows the same seasonal rhythm.
Where the cities diverge is in housing stock and how that interacts with energy exposure. Bloomington’s more vertical building character often means newer apartment complexes with shared walls, centralized heating systems, and better baseline insulation. Renters in these buildings may see more predictable utility bills because they’re heating smaller square footage with less exterior surface area exposed to cold. Brooklyn Park’s mixed housing stock includes more single-family homes and older low-rise units, which often have higher heating loads, less efficient HVAC systems, and more variability depending on home age and maintenance history. A family in an older Brooklyn Park home may face significantly higher heating costs than a couple in a newer Bloomington apartment, even though both cities share the same natural gas price.
Household size and housing type create different utility profiles. Single adults or couples in smaller apartments—common in both cities—will see lower absolute utility costs but similar seasonal spikes. Families in larger single-family homes face higher baseline usage and more exposure to heating volatility, especially if the home is older or poorly insulated. Bloomington’s slightly higher electricity rate becomes more noticeable for households running multiple high-draw devices (electric dryers, window AC units in summer, space heaters as backup) or working from home year-round. Brooklyn Park’s lower electricity rate offers modest relief, but the real cost driver remains heating fuel, and both cities are equally exposed to natural gas price swings and extreme cold snaps that push usage beyond typical winter averages.
Utility takeaway: Both cities face high heating exposure and similar seasonal volatility. Bloomington’s slightly higher electricity rate matters most for high-usage households or those relying on electric heating; Brooklyn Park’s lower rate offers marginal relief. The bigger factor is housing stock: newer, more vertical buildings in Bloomington may deliver more predictable utility costs, while older single-family homes in Brooklyn Park expose households to higher heating loads and more variability. Families in older homes and households sensitive to seasonal bill spikes will feel utility pressure more acutely, regardless of city.
Groceries and Daily Expenses: Corridor Access Shapes Spending
Grocery and daily spending pressure in Brooklyn Park and Bloomington is less about price differences and more about access patterns and how those patterns influence household behavior. Both cities show corridor-clustered food and grocery access, meaning stores and restaurants concentrate along major commercial strips rather than being evenly distributed across neighborhoods. That structure rewards households with flexible schedules, reliable transportation, and the ability to plan trips efficiently. It penalizes households juggling tight schedules, relying on quick errands between work and home, or managing last-minute needs without a car readily available.
For staple groceries—bread, eggs, milk, chicken, ground beef—both cities reflect the same regional price environment, with no meaningful structural difference in baseline costs. The real divergence comes in convenience spending: how often a household resorts to takeout because meal prep didn’t happen, grabs coffee on the way to work, or makes an extra trip to a closer (but pricier) store because the main grocery run didn’t cover everything. Bloomington’s more vertical building character and slightly denser commercial corridors may offer more walkable access to convenience stores, coffee shops, and quick-service restaurants in certain neighborhoods. That can reduce car dependency for small errands but also increases the temptation to spend on prepared foods and impulse purchases. Brooklyn Park’s more spread-out layout often requires deliberate trips, which can enforce discipline (fewer spontaneous purchases) but also increases the friction cost of forgetting an item or needing something outside the planned shopping routine.
Household size amplifies these dynamics. Single adults and couples can often consolidate grocery trips, batch-cook meals, and avoid convenience spending with modest planning. Families managing multiple schedules, dietary preferences, and higher grocery volumes face more friction: forgotten lunch items, after-school snack runs, last-minute dinner pivots. In both cities, that friction translates into either time cost (extra trips, longer drives) or cash cost (paying for convenience). Bloomington’s denser corridors may reduce time cost slightly for some households; Brooklyn Park’s layout may reduce temptation but increase logistical burden. Neither city offers blanket grocery savings—the difference is whether your household’s rhythm aligns with corridor-based access or fights against it.
Grocery takeaway: Both cities share similar baseline grocery prices and corridor-clustered access. The cost difference emerges in convenience spending and logistical friction. Bloomington’s denser commercial corridors may reduce time cost for quick errands but increase exposure to impulse spending. Brooklyn Park’s more spread-out layout enforces trip discipline but increases the burden of forgotten items and last-minute needs. Families and households with tight schedules will feel grocery friction more acutely; singles and couples with flexible routines can navigate either city without significant cost pressure.
Taxes and Fees: Ownership Costs and Predictability
Property taxes and local fees in Brooklyn Park and Bloomington follow the same regional structure, but the differences in home values create different absolute obligations. Bloomington’s higher median home value means higher annual property tax bills, even if the millage rate is similar. For a household comparing a $289,400 home in Brooklyn Park to a $327,100 home in Bloomington, the difference in assessed value translates directly into hundreds of dollars per year in additional property tax liability. That gap compounds over time, especially for long-term residents who stay through multiple assessment cycles and see their home values appreciate.
Both cities also impose local fees for services like trash collection, water, and sewer, though the specific structures and amounts vary by neighborhood and housing type. Homeowners in single-family homes typically pay these fees directly and have more visibility into what they’re covering. Renters in larger apartment complexes often see these costs bundled into rent or charged as separate line items, with less control over usage or billing. Bloomington’s more vertical housing stock means more renters encounter bundled fee structures, which can increase predictability but reduce flexibility. Brooklyn Park’s mixed housing stock offers more variety: some neighborhoods have HOA fees that cover landscaping and snow removal, others leave those costs to individual homeowners, and still others fall somewhere in between.
The predictability of taxes and fees matters differently depending on household tenure and housing type. First-time buyers in Brooklyn Park face lower baseline property taxes and may have more control over discretionary fees (choosing whether to pay for lawn service, opting into neighborhood amenities). Buyers in Bloomington face higher baseline obligations but may benefit from newer infrastructure, more comprehensive city services, or HOA-managed amenities that reduce individual maintenance burdens. Renters in both cities are largely insulated from property tax volatility but absorb it indirectly through rent increases. Long-term homeowners in either city face the same risk: rising assessments, special assessments for infrastructure improvements, and the gradual accumulation of fees that weren’t part of the initial budget.
Taxes and fees takeaway: Bloomington’s higher home values drive higher property tax obligations, which compound over time for long-term owners. Brooklyn Park’s lower baseline taxes offer more breathing room for first-time buyers and households sensitive to ongoing obligations. Fee structures vary more by housing type than by city, with Bloomington’s vertical density favoring bundled predictability and Brooklyn Park’s mixed stock offering more control but more variability. Homeowners planning to stay several years will feel the cumulative difference in property taxes most; renters experience these costs indirectly through rent adjustments.
How People Actually Move Around Brooklyn Park and Bloomington
Transportation costs in Brooklyn Park and Bloomington are shaped less by fuel prices—both cities share the same $2.63 per gallon rate—and more by how daily errands, commutes, and household logistics actually play out. Both cities show walkable pockets, meaning certain neighborhoods have pedestrian infrastructure that supports walking for some trips, but neither city offers blanket walkability across all residential areas. Both cities also have notable bike infrastructure and bus-only transit service, which provides baseline connectivity but doesn’t eliminate car dependency for most households. The real question isn’t whether you need a car—you almost certainly do—but how often you use it, how far you drive, and whether your daily routine clusters trips efficiently or scatters them across the metro.
Bloomington has documented commute data showing an average of 21 minutes, with about a quarter of workers facing longer commutes and only 3% working from home. That suggests most Bloomington residents are commuting to jobs elsewhere in the metro, likely driving, and absorbing both time and fuel costs daily. Brooklyn Park lacks specific commute data in the feed, but its position in the northwest metro and similar transit infrastructure suggest comparable patterns: most households rely on cars for work trips, errands cluster along commercial corridors, and bus service functions as a backup rather than a primary mode. Both cities’ corridor-clustered grocery and errand access means that even short trips often require driving, especially for families managing multiple stops or hauling larger purchases.
The experiential difference comes down to trip frequency and whether your household’s rhythm aligns with the city’s layout. Bloomington’s more vertical building character and denser commercial corridors may allow some households to consolidate errands more easily, reducing the number of distinct car trips per week. Brooklyn Park’s more spread-out layout may require more deliberate trip planning, but it also offers more parking availability and less congestion during peak times. For families juggling school drop-offs, after-school activities, and grocery runs, both cities demand car ownership and careful scheduling. For singles or couples with flexible schedules and fewer logistical constraints, both cities offer enough bike and bus infrastructure to reduce car dependency slightly—but only in specific neighborhoods and only for specific trip types.
Transportation takeaway: Both cities require car ownership for most households. Fuel costs are identical, and transit infrastructure is similar (bus service, notable bike presence, walkable pockets). Bloomington’s documented 21-minute average commute suggests moderate time costs; Brooklyn Park likely follows similar patterns. The real difference is whether your household’s daily logistics align with corridor-based access and whether you can consolidate trips efficiently. Families and households with complex schedules will face similar transportation pressure in both cities; singles and couples with flexible routines may find marginal relief from bike and bus options in specific neighborhoods.
Cost Structure Comparison: Where Pressure Concentrates
Housing dominates the cost experience in both Brooklyn Park and Bloomington, but the nature of that pressure differs. Brooklyn Park’s lower home values and rents create a lower entry barrier, making it more accessible for first-time buyers, renters stretching budgets, and families prioritizing space over location. Bloomington’s higher housing costs demand more upfront capital and higher monthly obligations, but those costs may come with newer construction, better insulation, and more predictable utility exposure. For households where housing affordability is the binding constraint—where every dollar of rent or mortgage payment matters—Brooklyn Park offers more breathing room. For households where housing quality, building age, or specific location factors reduce other costs (shorter commutes, lower utility bills), Bloomington’s premium may justify itself.
Utilities introduce similar volatility in both cities, driven by Minnesota’s long heating season and identical natural gas pricing. Bloomington’s slightly higher electricity rate matters most for high-usage households, but the bigger factor is housing stock: newer, more vertical buildings in Bloomington may deliver more predictable utility costs, while older single-family homes in Brooklyn Park expose households to higher heating loads and more seasonal variability. Families in older homes, households with high electricity usage, and anyone sensitive to seasonal bill spikes will feel utility pressure more acutely, regardless of city. The difference isn’t about one city being cheaper—it’s about whether your housing type insulates you from volatility or amplifies it.
Groceries and daily expenses follow the same regional price environment in both cities, with no meaningful baseline difference. The cost divergence comes from access friction and convenience spending. Bloomington’s denser commercial corridors may reduce time cost for quick errands but increase exposure to impulse purchases and prepared food spending. Brooklyn Park’s more spread-out layout enforces trip discipline but increases the logistical burden of forgotten items and last-minute needs. For families managing tight schedules and multiple household members, that friction translates into either time cost (extra trips, longer drives) or cash cost (paying for convenience). For singles and couples with flexible routines, both cities offer enough access to avoid significant grocery pressure.
Transportation patterns matter more than fuel prices in both cities. Identical gas prices and similar transit infrastructure mean the real cost driver is trip frequency, commute distance, and whether your household’s daily logistics cluster efficiently or scatter across the metro. Bloomington’s documented 21-minute average commute suggests moderate time costs; Brooklyn Park likely follows similar patterns. Both cities demand car ownership for most households, and both offer marginal relief from bike and bus options in specific neighborhoods. The difference is whether your household’s rhythm aligns with corridor-based access and whether you can consolidate trips without adding significant time burden.
The better choice depends entirely on which costs dominate your household and which tradeoffs you’re equipped to manage. Households sensitive to housing entry barriers may prefer Brooklyn Park’s lower baseline costs. Households prioritizing newer construction, more predictable utilities, or specific location factors may justify Bloomington’s premium. For families managing complex schedules, both cities demand careful trip planning and car ownership. For singles and couples with flexible routines, both cities offer enough infrastructure to reduce car dependency slightly. The decision isn’t about which city is cheaper overall—it’s about where cost pressure shows up, which expenses you can control, and which you simply absorb.
How the Same Income Feels in Brooklyn Park vs Bloomington
Single Adult
For a single adult, housing becomes the first non-negotiable cost, and Brooklyn Park’s lower rent baseline offers immediate breathing room. Flexibility exists in grocery spending, transportation choices, and discretionary purchases, especially if the household can consolidate errands and avoid convenience spending. Bloomington’s higher rent may crowd out savings or force tighter budgeting elsewhere, but newer buildings and denser corridors may reduce utility volatility and errand friction. The difference is whether housing cost eats into flexibility or whether location and building quality reduce other expenses enough to offset the premium.
Dual-Income Couple
For a dual-income couple, housing still dominates, but the ability to split costs creates more flexibility in both cities. Brooklyn Park’s lower entry barrier makes homeownership more accessible, while Bloomington’s higher costs may delay buying or require a longer savings period. Flexibility exists in transportation (carpooling, trip consolidation) and discretionary spending, but commute friction and errand logistics can erode that flexibility quickly if both partners work in different parts of the metro. Bloomington’s denser corridors may reduce time cost for errands; Brooklyn Park’s lower housing cost may reduce financial pressure. The tradeoff is whether time savings justify higher housing costs or whether financial breathing room matters more.
Family with Kids
For a family with kids, housing, transportation, and grocery logistics all become non-negotiable, and flexibility disappears quickly. Brooklyn Park’s lower housing costs and more single-family options offer space and yard access, but older homes may increase utility exposure and maintenance burdens. Bloomington’s higher housing costs may come with newer construction and lower utility volatility, but the premium reduces flexibility elsewhere. Both cities show limited school and playground density, meaning families rely on car trips for activities and errands. Grocery friction intensifies with more household members, more dietary needs, and more last-minute trips. The difference is whether housing cost pressure or logistical friction dominates the household’s experience, and whether the family can absorb higher upfront costs in exchange for reduced volatility or must prioritize lower baseline obligations to preserve flexibility.
Decision Matrix: Which City Fits Which Household?
| Decision Factor | If You’re Sensitive to This… | Brooklyn Park Tends to Fit When… | Bloomington Tends to Fit When… |
|---|---|---|---|
| Housing entry + space needs | Down payment size, monthly mortgage or rent, yard access, room for kids | You need lower entry costs, more space per dollar, and more single-family options | You prioritize newer construction, more vertical density, and can absorb higher baseline costs |
| Transportation dependence + commute friction | Daily drive time, trip consolidation, car dependency, fuel spending | You can plan trips deliberately and tolerate more spread-out errand access | You value denser corridors that may reduce trip frequency and time cost |
| Utility variability + home size exposure | Seasonal heating spikes, electricity usage, insulation quality, building age | You can manage older home maintenance and accept more seasonal volatility | You prioritize newer buildings with better insulation and more predictable utility costs |
| Grocery strategy + convenience spending creep | Impulse purchases, takeout frequency, errand friction, trip planning discipline | You prefer trip discipline and less temptation from dense commercial corridors | You value reduced time cost for quick errands and can resist convenience spending |
| Fees + friction costs (HOA, services, upkeep) | Property taxes, HOA fees, maintenance obligations, predictability of recurring costs | You want lower baseline property taxes and more control over discretionary fees | You can absorb higher property taxes in exchange for newer infrastructure and bundled services |
| Time budget (schedule flexibility, errands, logistics) | Juggling multiple schedules, school drop-offs, activity coordination, errand consolidation | You have flexible schedules and can plan trips without tight time constraints | You need denser access to reduce time cost and can pay for that convenience |
Lifestyle Fit: Parks, Commutes, and Daily Rhythms
Both Brooklyn Park and Bloomington offer integrated green space access, with park density exceeding high thresholds and water features present throughout. That means families, runners, dog owners, and anyone prioritizing outdoor access will find ample options in both cities. Brooklyn Park’s extensive park system includes regional trails, playgrounds, and natural areas that support year-round recreation. Bloomington’s green space network similarly provides trails, sports fields, and waterfront access, with the added benefit of proximity to larger metro amenities. For households where outdoor access is non-negotiable, both cities deliver strongly, and the choice comes down to specific park features, trail connectivity, or proximity to home rather than overall availability.
Commute patterns and daily logistics differ more subtly. Bloomington’s documented 21-minute average commute suggests most residents work elsewhere in the metro, likely driving, and face moderate time costs. Brooklyn Park’s position in the northwest metro likely follows similar patterns, with most households commuting to jobs in Minneapolis, St. Paul, or other suburbs. Both cities offer bus service and notable bike infrastructure, but neither eliminates car dependency for most households. The real lifestyle difference comes down to whether your job, your household’s activity schedule, and your daily errands align with the city’s layout. Bloomington’s more vertical building character and denser commercial corridors may feel more convenient for households juggling tight schedules and multiple stops. Brooklyn Park’s more spread-out layout may feel more spacious and less congested but requires more deliberate trip planning.
Both cities show limited school and playground density, meaning families with young children will rely on car trips for school drop-offs, after-school activities, and playdates. That’s a structural reality in both cities, not a unique drawback of either. Bloomington’s status as a college city (due to institutions within its boundaries) may offer more access to cultural events, continuing education, or part-time work opportunities for students and young professionals. Brooklyn Park’s lower housing costs may appeal more to families prioritizing space and yard access over proximity to college amenities. For households where lifestyle fit matters as much as cost structure, the decision comes down to whether you value density and convenience or space and lower baseline obligations—and whether your daily rhythm aligns with the city’s infrastructure.
Both cities offer strong park access and integrated green space. Bloomington’s more vertical density may reduce errand friction for some households; Brooklyn Park’s lower housing costs offer more space per dollar. Neither city eliminates car dependency, and both require deliberate trip planning for families managing complex schedules.
Common Questions About Brooklyn Park vs Bloomington in 2026
Which city has lower housing costs in 2026, Brooklyn Park or Bloomington? Brooklyn Park shows lower housing costs across both renting and buying. The median home value in Brooklyn Park is $289,400 compared to Bloomington’s $327,100, and median gross rent is $1,244 per month in Brooklyn Park versus $1,426 per month in Bloomington. That difference translates into lower down payment requirements, lower monthly mortgage obligations, and lower baseline rent for households in Brooklyn Park. Bloomington’s higher costs may come with newer construction and more vertical density, which can reduce utility exposure, but the entry barrier remains higher.
Do utility costs differ significantly between Brooklyn Park and Bloomington in 2026? Utility costs follow similar patterns in both cities, driven by Minnesota’s long heating season and identical natural gas pricing. Bloomington’s electricity rate is slightly higher at 16.37¢/kWh compared to Brooklyn Park’s 15.67¢/kWh, which matters most for high-usage households or those relying on electric