Most people assume Bowie is more expensive than Laurel because of its higher median income and newer suburban feel. But that myth oversimplifies how costs actually show up in daily life. While Bowie does have higher housing entry costs, the real story is about where cost pressure concentrates and which households feel it most. Both cities sit in the Washington, DC metro area, share the same utility rates and gas prices, and offer rail transit access. The decision between them isn’t about one being universally cheaper—it’s about whether your household is more exposed to housing barriers or to the friction costs of car-dependent errands, and whether you value space and income-matching neighborhoods over walkable daily infrastructure.
In 2026, the choice between Bowie and Laurel comes down to lifestyle structure and cost timing. Bowie offers more space and a higher-income peer environment, but requires more driving for groceries and routine errands. Laurel provides denser access to food, parks, schools, and clinics, with lower rent and home prices, but in a more vertically built, urban-adjacent form. The same gross monthly income feels different in each city—not because one is objectively more affordable, but because the non-negotiable costs hit different categories first.
This article explains how housing, utilities, groceries, transportation, and daily logistics costs behave differently in Bowie and Laurel, and which households fit best in each place based on what they’re most sensitive to.
Housing Costs
Housing is where the two cities diverge most clearly. Bowie’s median home value sits at $419,200, while Laurel’s is $354,400. For renters, the gap is similarly wide: Bowie’s median gross rent is $2,167 per month, compared to Laurel’s $1,831. These aren’t small differences—they represent distinct entry barriers and ongoing obligations that shape which households can access each city and how much flexibility remains after housing is paid.
Bowie’s housing stock skews toward single-family homes with more square footage, appealing to families seeking space, yards, and a suburban environment where most neighbors earn in a similar income band. The higher home values reflect not just size but also the expectation of a certain lifestyle: newer construction, HOA-managed communities, and neighborhoods designed around car access rather than walkability. Laurel, by contrast, shows more vertical building character and mixed housing types, including apartments, townhomes, and older single-family stock. This creates more entry points for renters and first-time buyers who prioritize location and access over square footage.
For renters, the $336 monthly difference between Bowie and Laurel adds up to over $4,000 annually in gross obligation before any utilities, parking, or fees. That gap matters most for single adults and younger couples who are rent-sensitive and prioritize proximity to work, errands, and transit over extra bedrooms. Families with kids face a different calculation: Bowie’s higher rent buys more space and often includes access to higher-rated school districts, but Laurel’s lower rent leaves more room in the budget for childcare, activities, and the inevitable creep of family logistics costs.
Homeownership amplifies these differences. The higher purchase price in Bowie means larger down payments, higher monthly mortgage obligations, and greater exposure to property taxes and insurance. Buyers in Bowie are typically higher-income households who can absorb the entry cost and value the space, school access, and neighborhood character. Laurel’s lower home values make ownership more accessible to moderate-income households, but the tradeoff is often older housing stock that may carry higher maintenance and utility costs over time.
Housing takeaway: Bowie’s housing costs create a higher entry barrier and ongoing obligation, fitting households with stable, higher incomes who prioritize space and suburban character. Laurel’s lower rent and home prices open access to a broader income range, especially for renters and first-time buyers willing to trade square footage for walkable infrastructure and lower monthly obligations. The pressure in Bowie is front-loaded and space-driven; in Laurel, it’s more about managing density and older housing stock.
Utilities and Energy Costs

Utilities in Bowie and Laurel are structurally identical because both cities fall under the same regional providers and climate zone. Electricity costs 21.34¢ per kWh, and natural gas runs $17.52 per MCF in both places. There’s no price advantage to living in one city over the other when it comes to energy rates. The differences emerge in how housing type, age, and size translate those rates into actual monthly exposure.
Bowie’s housing stock tends toward larger single-family homes, many built in the last few decades with modern insulation and HVAC systems. Larger homes mean more square footage to heat and cool, but newer construction often offsets some of that exposure through better windows, insulation, and efficient systems. Families in Bowie with 2,500+ square-foot homes will see higher baseline utility costs than smaller households, but the bills are relatively predictable across seasons. Summer cooling dominates, driven by Maryland’s humid heat, but the expense is steady rather than spiking wildly month to month.
Laurel’s more vertical building character and mixed housing types create different utility dynamics. Apartments and townhomes generally use less energy than detached single-family homes because shared walls reduce heating and cooling loss. However, Laurel also has older housing stock, and older homes—especially those without updated insulation or efficient HVAC—can experience higher utility volatility. A family renting an older single-family home in Laurel may face higher heating costs in winter and cooling costs in summer than a similar household in a newer Bowie home, even though the rates are identical.
Household size and housing form matter more than location. A single adult in a Laurel apartment will have lower utility costs than a family of four in a Bowie house, but that’s driven by square footage and occupancy, not by city-level differences. The key decision factor is predictability versus volatility: newer, larger homes in Bowie offer more stable bills with higher baselines, while older or smaller homes in Laurel may see more seasonal swings depending on the condition of the structure.
Utility takeaway: Utility costs don’t favor one city over the other—they favor newer construction and smaller square footage. Bowie households in larger, newer homes face higher but predictable bills. Laurel households in older stock or apartments face lower baselines but potentially more volatility depending on building age and efficiency. The exposure is less about the city and more about what you’re heating, cooling, and how well it’s insulated.
Groceries and Daily Expenses
Grocery prices in Bowie and Laurel are shaped by the same regional price parity index (104), meaning staple items like bread, milk, eggs, and chicken cost roughly the same at checkout in both cities. But how much households actually spend—and how much friction they experience getting groceries—differs significantly because of access density and shopping infrastructure.
Bowie shows sparse food and grocery establishment density, meaning fewer stores per square mile and longer drives to reach full-service supermarkets or specialty options. This doesn’t make groceries more expensive per item, but it does mean households are more likely to consolidate trips, rely on big-box stores, and plan around car access. For families doing weekly bulk shopping, this works fine and may even reduce impulse spending. For single adults or couples who prefer frequent small trips, grab-and-go meals, or walkable access to fresh food, Bowie’s car-dependent grocery landscape adds time cost and reduces flexibility.
Laurel, by contrast, shows broadly accessible food and grocery density, with more establishments distributed throughout the city. This means shorter distances to supermarkets, more options for quick stops, and better access to prepared foods, delis, and smaller-format stores. Households in Laurel can more easily walk or make short drives for daily needs, which reduces planning burden but can also increase convenience spending. The tradeoff is between Bowie’s lower-frequency, higher-planning grocery model and Laurel’s higher-frequency, lower-friction model.
Dining out and convenience spending follow similar patterns. Laurel’s denser commercial infrastructure means more restaurants, coffee shops, and takeout options within easy reach, which can quietly increase monthly spending for households that value convenience. Bowie’s more spread-out layout naturally limits impulse dining and coffee runs, which can help households stay disciplined but also means less flexibility when schedules get tight. Families with kids often find Bowie’s model easier to budget because fewer options mean fewer requests; single adults and dual-income couples may prefer Laurel’s access even if it costs slightly more over time.
Grocery takeaway: Grocery prices are equivalent, but access structure differs sharply. Bowie fits households who plan ahead, drive for groceries, and want to limit convenience spending creep. Laurel fits households who value walkable access, frequent small trips, and flexibility in daily routines, even if that convenience increases spending slightly. The cost difference isn’t in the cart—it’s in the time, planning, and friction required to fill it.
Taxes and Fees
Both Bowie and Laurel sit in Prince George’s County, Maryland, which means they share the same county-level property tax structure and state tax framework. There’s no city-level income tax difference, and sales tax rates are identical. The meaningful differences in tax and fee exposure come from housing values, HOA prevalence, and the types of services that are bundled versus billed separately.
Property taxes in Maryland are assessed at the county level, so the primary driver of tax obligation is home value, not city of residence. Bowie’s higher median home value ($419,200) means homeowners there face higher annual property tax bills than Laurel homeowners (median $354,400), even though the rate structure is the same. For a household comparing similar-sized homes in both cities, the Bowie property will carry a higher tax obligation simply because of its assessed value. This matters most for long-term owners and retirees on fixed incomes, where property tax becomes a growing share of annual housing costs over time.
HOA fees are more prevalent in Bowie, where many neighborhoods are planned communities with shared amenities like pools, playgrounds, and landscaping. These fees can range from modest monthly amounts to several hundred dollars, depending on what’s included. In some cases, HOA fees bundle services like trash, snow removal, and exterior maintenance, which can simplify budgeting but also create a fixed obligation that doesn’t flex with household needs. Laurel has fewer HOA-managed communities, meaning more homeowners pay for services individually or handle maintenance themselves. This offers more control but also more variability and planning burden.
Renters in both cities typically see trash and water billed separately or included in rent, depending on the landlord and building type. Larger apartment complexes in Laurel are more likely to bundle utilities and services into rent, which increases predictability but also limits control. Single-family rentals in Bowie more often pass utilities and fees directly to tenants, which means more line items to track but also more ability to reduce costs through conservation.
Tax and fee takeaway: Property taxes are higher in Bowie due to higher home values, not higher rates. HOA fees are more common in Bowie and add predictability but also fixed costs. Laurel offers more control over individual services but requires more active management. Homeowners planning to stay long-term should weigh property tax exposure carefully; renters should focus on what’s bundled versus billed separately and how much control they want over monthly obligations.
Transportation & Commute Reality
Both Bowie and Laurel offer rail transit access, which is a significant advantage in the Washington, DC metro area. Commuters in both cities can reach Union Station, federal offices, and downtown employers without driving, which reduces gas, parking, and vehicle wear costs. But the day-to-day transportation experience differs because of commute length, car dependence for errands, and how much flexibility households have in their schedules.
Bowie’s average commute time is 36 minutes, with 61.6% of workers experiencing long commutes (typically defined as over 30 minutes). Laurel’s average is slightly shorter at 33 minutes, with 54.9% facing long commutes. The difference isn’t dramatic, but it compounds over time: three extra minutes each way adds up to 30 minutes per week, or roughly 26 hours per year. For households where both adults commute, that time cost becomes more significant, especially when paired with Bowie’s car-dependent errands structure.
Bowie’s sparse grocery and food establishment density means most households rely on cars for daily errands, even if they take transit to work. This creates a split transportation model: rail for commuting, car for everything else. Households with flexible schedules or the ability to work from home (18.7% in Bowie) can manage this more easily, but those with rigid schedules or multiple stops per day face more friction. Laurel’s broadly accessible food and grocery density reduces car dependence for errands, meaning households can more easily walk, bike, or make short drives for daily needs. This doesn’t eliminate the need for a car, but it reduces how often it’s required and how much planning each trip demands.
Gas prices are identical in both cities ($2.93 per gallon), so the cost difference comes from how many miles households drive and how often they’re forced into the car for non-commute trips. Bowie households with long commutes and frequent errands will burn more fuel and accumulate more vehicle wear over time. Laurel households with shorter commutes and walkable errands can stretch each tank further and reduce maintenance frequency, even if they still own and use a car regularly.
Transportation takeaway: Both cities offer rail transit, but Bowie’s longer average commute and car-dependent errands structure increase time and fuel costs for households with rigid schedules or multiple daily stops. Laurel’s shorter commute and denser errands infrastructure reduce car dependence and planning friction, fitting households that value walkability and flexibility even if they still own a vehicle. The cost difference is less about gas prices and more about how much driving is required to function day-to-day.
Cost Structure Comparison
Housing dominates the cost experience in both cities, but the pressure shows up differently. Bowie’s higher rent and home values create a larger upfront and ongoing obligation, which matters most for households stretching to afford entry or managing fixed incomes. Laurel’s lower housing costs open access to a broader income range but often come with older housing stock and denser living arrangements, which shift pressure toward maintenance, utilities in older buildings, and managing less square footage per person.
Utilities introduce similar baseline exposure in both cities because rates are identical, but the volatility differs based on housing age and size. Bowie’s newer, larger homes offer predictable bills with higher baselines; Laurel’s older or smaller homes may see more seasonal swings depending on insulation and efficiency. Families in large Bowie homes face steady, higher costs; renters in Laurel apartments face lower baselines but less control over building-level efficiency.
Daily living and groceries don’t differ in price per item, but access structure creates friction cost differences. Bowie’s sparse grocery density forces more planning, longer drives, and consolidated trips, which works well for disciplined planners but adds time cost and reduces flexibility. Laurel’s broadly accessible food and grocery infrastructure reduces planning burden and supports more spontaneous, frequent trips, which can increase convenience spending but also saves time and reduces car dependence.
Transportation patterns matter more in Bowie, where longer commutes and car-dependent errands compound into higher fuel costs, more vehicle wear, and more time spent managing logistics. Laurel’s shorter commutes and walkable errands reduce car dependence and planning friction, fitting households that value time flexibility and want to limit how often they’re forced into the car for routine needs.
The better choice depends on which costs dominate your household. Households sensitive to housing entry barriers and ongoing rent or mortgage obligations may find Laurel more accessible, especially if they value walkable infrastructure and don’t need maximum square footage. Households with stable, higher incomes who prioritize space, newer construction, and income-matching neighborhoods may prefer Bowie, even if it means more driving and higher upfront costs. For families, the difference is less about total price and more about whether you’re optimizing for space and predictability (Bowie) or access and flexibility (Laurel).
How the Same Income Feels in Bowie vs Laurel
Single Adult
For a single adult, housing becomes the first non-negotiable cost, and the difference between Bowie’s higher rent and Laurel’s lower rent directly affects how much flexibility remains for everything else. In Bowie, the higher rent buys more space but also locks in a larger fixed obligation, leaving less room for dining out, travel, or savings unless income is comfortably above the median. In Laurel, lower rent preserves more flexibility, but the denser errands infrastructure and proximity to restaurants and coffee shops can quietly increase convenience spending if not managed. The tradeoff is between Bowie’s space and predictability versus Laurel’s access and spontaneity.
Dual-Income Couple
For a dual-income couple, transportation friction and commute time become more visible because both partners are navigating schedules, errands, and logistics. In Bowie, longer commutes and car-dependent errands mean more time spent driving and more coordination required for grocery runs, appointments, and household tasks. In Laurel, shorter commutes and walkable errands reduce planning burden and create more flexibility for splitting responsibilities or handling last-minute needs. The same combined income feels tighter in Bowie if both partners have rigid schedules or long commutes; it feels more flexible in Laurel if proximity to work, transit, and daily errands reduces time cost and car dependence.
Family with Kids
For families, housing space and school access become non-negotiable first, but daily logistics costs—childcare, activities, groceries, healthcare—quickly consume whatever flexibility remains. In Bowie, higher housing costs and car-dependent errands mean more upfront obligation and more driving, but the space and suburban character often align with family priorities. In Laurel, lower housing costs leave more room in the budget for childcare and activities, and the denser park, school, and clinic infrastructure reduces the time and friction required to manage family logistics. The same income feels more stretched in Bowie if the family is managing tight schedules and multiple daily stops; it feels more manageable in Laurel if walkable access to schools, parks, and groceries reduces the planning burden and car dependence that quietly drain both time and money.
Decision Matrix: Which City Fits Which Household?
| Decision factor | If you’re sensitive to this… | Bowie tends to fit when… | Laurel tends to fit when… |
|---|---|---|---|
| Housing entry + space needs | You need to minimize upfront costs or maximize square footage per dollar | You have stable higher income and prioritize space and newer suburban character | You prioritize lower rent or purchase price and can trade space for access |
| Transportation dependence + commute friction | You want to reduce car dependence and limit time spent driving for errands | You have flexible schedules and don’t mind driving for groceries and daily needs | You value shorter commutes and walkable errands infrastructure to reduce planning burden |
| Utility variability + home size exposure | You want predictable bills or need to minimize baseline usage | You prefer newer construction with stable bills even if baselines are higher | You prefer smaller square footage or apartments with lower baselines despite potential volatility |
| Grocery strategy + convenience spending creep | You want to control impulse spending or need walkable access to fresh food | You prefer consolidated trips and disciplined planning to limit convenience spending | You value frequent small trips and proximity to food options even if it increases spending |
| Fees + friction costs (HOA, services, upkeep) | You want bundled predictability or prefer to control individual services | You value HOA-managed amenities and predictable bundled fees | You prefer direct control over services and want to avoid fixed HOA obligations |
| Time budget (schedule flexibility, errands, logistics) | You need to minimize daily logistics friction and maximize schedule flexibility | You have flexible work arrangements and can absorb longer commutes and car-dependent errands | You have rigid schedules or multiple daily stops and need walkable infrastructure to reduce time cost |
Lifestyle Fit
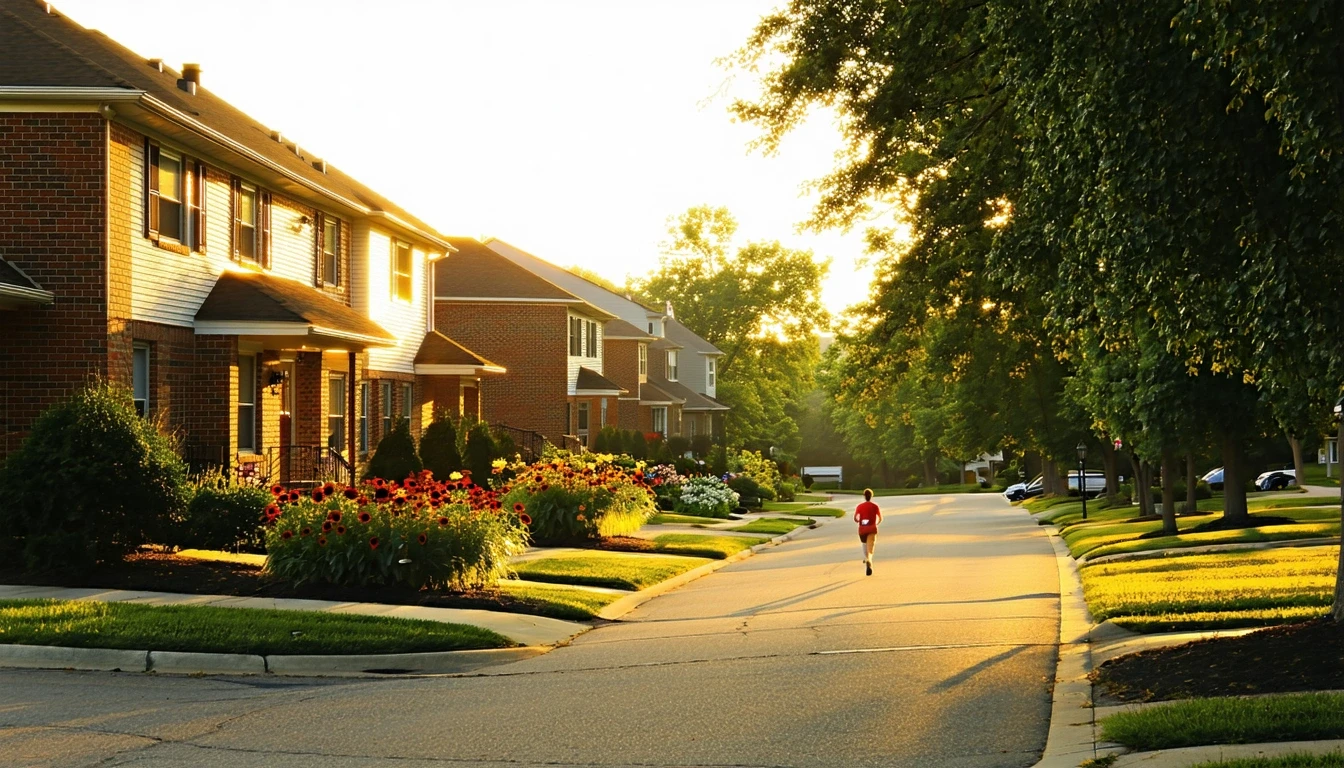
Beyond the numbers, Bowie and Laurel offer distinct lifestyle textures shaped by their infrastructure, density, and daily rhythms. Bowie’s suburban character emphasizes space, privacy, and car-oriented convenience, with neighborhoods designed around single-family homes, cul-de-sacs, and planned communities. The city has walkable pockets and rail transit access, but daily life still revolves around driving for groceries, errands, and most activities. This fits households that value quiet streets, yards, and the ability to retreat into a more insulated residential environment. Families with young kids often appreciate the space for outdoor play and the sense of separation from urban density.
Laurel offers a more urban-adjacent experience, with higher building density, mixed-use areas, and stronger pedestrian infrastructure in parts of the city. The presence of parks, schools, and clinics within shorter distances reduces the need to drive for routine needs, and the denser food and grocery access means more options for spontaneous stops and walkable errands. This fits households that value proximity over space and prefer a more integrated, less car-dependent daily rhythm. The tradeoff is less privacy and smaller living spaces, but also less time spent in the car and more flexibility in how you structure your day.
Both cities offer rail transit access, which matters most for commuters working in downtown DC or federal offices. But the lifestyle difference extends beyond the commute: Bowie’s longer average commute and car-dependent errands mean more time spent managing logistics, while Laurel’s shorter commute and denser infrastructure reduce friction and create more margin in daily schedules. For households where both adults work and manage kids or other responsibilities, that margin can be the difference between feeling constantly behind and feeling like you have some control over your time.
Quick fact: Bowie’s work-from-home percentage (18.7%) is higher than Laurel’s (14.7%), suggesting more flexibility in commute patterns for some households.
Quick fact: Laurel’s park density exceeds high thresholds and school density is also high, making it easier for families to access outdoor space and educational infrastructure without driving.
Frequently Asked Questions
Is Bowie or Laurel cheaper for renters in 2026?
Laurel has lower median gross rent ($1,831 per month) compared to Bowie ($2,167 per month), which reduces the upfront housing obligation and leaves more flexibility in the budget for other expenses. The difference matters most for single adults and couples who are rent-sensitive and prioritize access to transit, groceries, and parks over maximum square footage. Bowie’s higher rent typically buys more space and newer construction, but also locks in a larger fixed cost that limits flexibility unless income is comfortably above the median.
Which city has lower transportation costs, Bowie or Laurel, in 2026?
Gas prices are identical in both cities, but transportation costs differ based on commute length and car dependence for errands. Bowie’s longer average commute (36 minutes vs 33 in Laurel) and sparse grocery density mean more driving for both work and daily needs, which increases fuel costs and vehicle wear over time. Laurel’s shorter commute and broadly accessible food and grocery infrastructure reduce car dependence and planning friction, fitting households that want to limit how often they’re forced into the car for routine errands.
Do utilities cost more in Bowie or Laurel in 2026?
Utility rates are identical in both cities (21.34¢/kWh for electricity, $17.52/MCF for natural gas), so the cost difference comes from housing size, age, and efficiency. Bowie’s larger, newer homes tend to have higher baseline utility costs but more predictable bills across seasons. Laurel’s mix of apartments, townhomes, and older single-family homes often results in lower baselines but more volatility depending on building age and insulation. The exposure is driven more by what you’re heating and cooling than by which city you live in.
Is Bowie or Laurel better for families with kids in 2026?
The better choice depends on whether your family prioritizes space and suburban character (Bowie) or walkable access to parks, schools, and clinics (Laurel). Bowie offers more square footage, newer construction, and income-matching neighborhoods, but requires more driving for errands and has limited healthcare access within the city. Laurel has lower housing costs, high school and park density, and routine local healthcare access, which reduces the time and friction required to manage family logistics. Families with tight schedules or multiple daily stops often find Laurel’s infrastructure reduces planning burden, while families who value space and can absorb more driving may prefer Bowie.
Which city is more affordable overall, Bowie or Laurel, in 2026?
There’s no universal answer because affordability depends on which costs dominate your household. Laurel has lower housing entry costs and denser daily infrastructure, which reduces car dependence and planning friction, fitting households that prioritize access and flexibility. Bowie has higher housing costs but offers more space, newer construction, and a suburban environment that fits households with stable higher incomes who value predictability and don’t mind driving for errands. The decision is less about which city is cheaper overall and more about whether you’re more exposed to housing entry barriers or to the time and friction costs of car-dependent daily life.
Conclusion
The myth that Bowie is simply more expensive than Laurel misses the structural differences that actually shape how costs show up in daily life. Bowie’s higher housing costs create a larger entry barrier and ongoing obligation, but they also buy more space, newer construction, and a suburban environment that fits households with stable higher incomes who value predictability and don’t mind driving for errands. Laurel’s lower rent and home prices open access to a broader income range and come with denser infrastructure—broadly accessible groceries, integrated parks, strong family amenities, and routine local healthcare—that reduces car dependence and planning friction. The cost difference isn’t about one city being universally cheaper; it’s about where pressure concentrates and which households feel it most.
For single adults and younger couples, Laurel’s lower rent and walkable errands infrastructure preserve more flexibility and reduce the time cost of managing daily logistics. For families, the choice depends on whether you prioritize space and suburban character (Bowie) or proximity to schools, parks, and clinics (Laurel). For dual-income households with rigid schedules, Laurel’s shorter commutes and denser infrastructure reduce friction; for households with flexible work arrangements and a preference for space, Bowie’s suburban model works well despite the higher upfront cost. The same gross income feels different in each city because the non-negotiable costs hit different categories first, and the tradeoffs between space, access, time, and money shift depending on what your household is most sensitive to.
How this article was built: In addition to public economic data, this article incorporates location-based experiential signals derived from anonymized geographic patterns—such as access density, walkability, and land-use mix—to reflect how day-to-day living actually feels in Bowie, MD.