Choosing between Boulder City and Las Vegas isn’t about finding the cheaper option—it’s about understanding where cost pressure shows up and which household feels it most. Both cities sit in the Las Vegas metro area, sharing the same desert climate, utility providers, and gas prices, but their housing markets, daily logistics, and lifestyle rhythms operate on completely different tracks. Boulder City offers a smaller-scale, low-rise environment with pockets of walkability and higher home values, while Las Vegas presents a larger urban footprint with lower purchase thresholds but higher rents. For families weighing space against convenience, commuters evaluating time costs, or first-time buyers managing entry barriers, the decision hinges on which cost structure aligns with how you actually live in 2026.
This comparison explains how housing, utilities, groceries, transportation, and daily errands behave differently in each city—not to declare a winner, but to show which households are more exposed to specific cost drivers. The same gross income can feel stable in one city and tight in the other, depending on whether your biggest financial pressure is front-loaded (down payments, moving costs) or ongoing (rent, commute friction, grocery logistics). Both cities share the same regional price environment, but the texture of daily life—how far you drive for groceries, whether you can walk to a park, how predictable your utility bills are—shapes the real cost experience far more than any single number.
What follows is a mechanism-based breakdown of where costs concentrate, how they interact, and which households feel the differences most acutely. No totals, no savings claims—just the structural tradeoffs that matter when you’re deciding where to live.
Housing Costs: Entry Barriers vs Ongoing Obligations
Housing is where Boulder City and Las Vegas diverge most sharply, and the difference isn’t just about price—it’s about whether cost pressure hits you upfront or every month. Boulder City’s median home value sits at $401,100, while Las Vegas comes in at $365,300. That gap translates directly into higher down payment requirements, closing costs, and mortgage qualification hurdles for buyers choosing Boulder City. First-time buyers or households stretching to enter homeownership face a steeper climb in Boulder City, where the entry barrier is more pronounced even though the cities are only 25 miles apart.
But the rental market flips the script. Boulder City’s median gross rent is $1,262 per month, while Las Vegas renters face $1,356 per month—a difference that compounds over a year into a meaningful ongoing obligation. For renters, Boulder City offers lower monthly housing costs, which can ease cash flow pressure and create more flexibility for other expenses. However, that advantage comes with a tradeoff: Boulder City’s smaller footprint and sparser commercial density mean fewer rental options overall, and competition for available units can be intense. Las Vegas renters pay more each month but gain access to a broader range of neighborhoods, apartment complexes, and housing types.
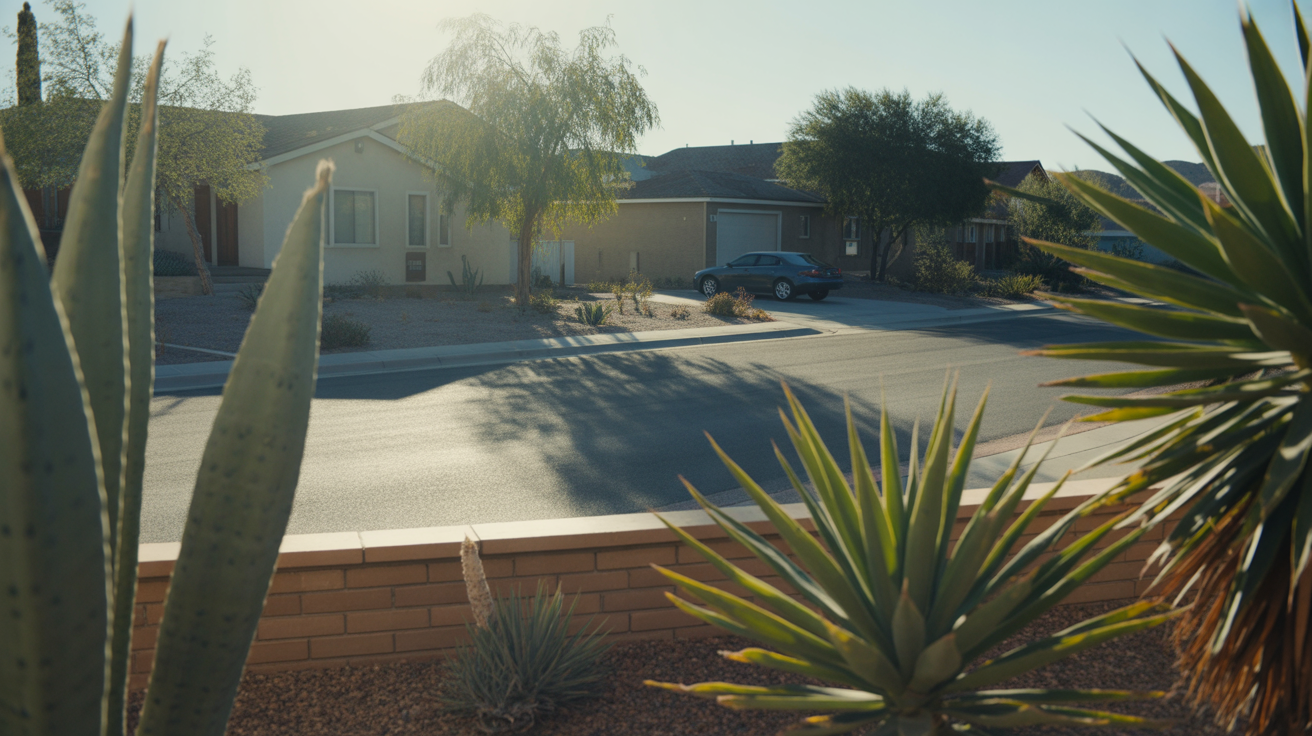
The housing stock itself also shapes cost behavior. Boulder City’s low-rise, mixed-use character (evidenced by its built environment) tends toward single-family homes and smaller apartment buildings, which can mean more space per unit but also more variability in condition and age. Las Vegas offers a wider mix of newer apartment complexes, townhomes, and single-family subdivisions, which can translate into more predictable maintenance costs and modern energy efficiency. For families prioritizing yard space or single-story living, Boulder City’s housing form may align better with those needs. For households prioritizing proximity to work, entertainment, or services, Las Vegas’s density and variety may reduce time costs even if rent runs higher.
Housing takeaway: Buyers face higher entry costs in Boulder City, while renters face higher ongoing obligations in Las Vegas. Households sensitive to upfront capital requirements may find Las Vegas more accessible for purchasing, while renters prioritizing lower monthly obligations may prefer Boulder City—provided they can navigate its smaller, less liquid rental market. The decision depends on whether your primary constraint is saving for a down payment or managing monthly cash flow.
Utilities and Energy Costs: Shared Rates, Different Exposure
Boulder City and Las Vegas share identical utility rate structures—13.77¢/kWh for electricity and $14.46/MCF for natural gas—because they draw from the same regional providers and regulatory environment. This means the price per unit of energy is the same whether you live in Boulder City or Las Vegas. But cost exposure isn’t determined by rates alone; it’s shaped by how much energy your household uses, which depends on home size, age, insulation quality, and cooling demands during the extended desert summer.
Both cities endure long, intense cooling seasons where air conditioning dominates utility bills from late spring through early fall. Older homes with single-pane windows, minimal insulation, or aging HVAC systems will experience higher usage regardless of location. Newer construction with modern insulation, dual-pane windows, and efficient cooling systems can significantly reduce consumption, but those homes are more common in newer Las Vegas subdivisions than in Boulder City’s older housing stock. Families moving into Boulder City may face higher cooling costs if they’re renting or buying an older single-family home, while those in newer Las Vegas apartments or townhomes may see more predictable, lower usage.
Home size also drives exposure. Single-family homes—more prevalent in Boulder City—require more energy to cool than smaller apartments, which benefit from shared walls and reduced exterior surface area. A family in a 1,500-square-foot Boulder City home will likely use more electricity than a couple in a 900-square-foot Las Vegas apartment, even though both pay the same rate. Households sensitive to utility volatility should consider housing type and age as much as location when evaluating energy costs.
Utility takeaway: Rates are identical, but exposure varies by housing type, age, and size. Families in older, larger homes face more volatility regardless of city, while households in newer, smaller units experience more predictable bills. Boulder City’s housing stock skews older and larger, which can amplify cooling costs; Las Vegas offers more variety, including newer, more efficient options that reduce usage even during peak summer months.
Groceries and Daily Expenses: Access vs Price Sensitivity
Grocery costs in Boulder City and Las Vegas are shaped by the same regional price environment—both cities share a regional price parity index of 97, meaning prices track slightly below the national baseline. Derived estimates for staples like bread ($1.78/lb), chicken ($1.96/lb), eggs ($2.63/dozen), and milk ($3.93/half-gallon) are identical across both cities. Derived estimate based on national baseline adjusted by regional price parity; not an observed local price. But the real difference isn’t what groceries cost—it’s how easy or difficult it is to access affordable options, and how much time and friction you absorb getting them.
Boulder City shows sparse food and grocery establishment density, meaning fewer stores overall and longer distances between them. Residents often rely on a small number of grocery anchors, and competition is limited. This can reduce flexibility for price-conscious shoppers who want to compare options or catch sales across multiple stores. It also means more driving for errands, which adds time costs and fuel consumption even though gas prices are identical ($3.35/gal in both cities). Families managing larger weekly grocery volumes may find Boulder City’s limited access frustrating, especially if they’re trying to minimize trips or avoid peak shopping times.
Las Vegas, by contrast, offers broader grocery access with more stores, more formats (discount chains, specialty markets, big-box retailers), and more geographic distribution. This doesn’t guarantee lower prices, but it does create more opportunities to shop strategically, use coupons, or switch stores based on weekly deals. Households sensitive to grocery spending can leverage that variety to reduce costs, while those prioritizing convenience can choose proximity over price. The density also reduces driving time for errands, which matters for dual-income households or families juggling school pickups and work schedules.
Dining out and convenience spending follow similar patterns. Las Vegas’s higher commercial density means more restaurant options, coffee shops, and takeout choices within a short drive or walk. That variety can tempt households into more frequent convenience spending, which adds up over time. Boulder City’s sparser commercial landscape naturally limits those opportunities, which can help households avoid spending creep—but it also means fewer options when you do want to eat out or grab a quick meal.
Grocery takeaway: Prices are regionally consistent, but access and friction differ sharply. Boulder City’s sparse grocery density increases time costs and reduces shopping flexibility, which matters most for families managing large volumes or price-sensitive budgets. Las Vegas offers more variety and proximity, which can lower friction and enable strategic shopping—but also creates more opportunities for convenience spending that can erode savings if not managed carefully.
Taxes and Fees: Structural Pressure Without Numeric Differences
Nevada’s tax structure applies uniformly across Boulder City and Las Vegas, meaning both cities benefit from the state’s lack of personal income tax and reliance on sales and property taxes to fund services. This creates a cost environment where ongoing tax pressure is tied more to consumption and housing value than to earnings. Households with higher spending or more valuable homes will feel more tax exposure, while those with modest consumption and lower-value properties experience less.
Property taxes in both cities are assessed based on home value, so Boulder City’s higher median home value ($401,100) translates into higher annual property tax bills for homeowners compared to Las Vegas’s lower median ($365,300). That difference is structural, not rate-based, and it affects long-term homeowners more than recent buyers, since assessed values rise over time. Renters don’t pay property taxes directly, but landlords pass those costs through in rent, so the effect is indirect but real.
Local fees—trash collection, water, sewer, and any special assessments—can vary by jurisdiction and housing type. Homeowners associations (HOAs) are common in both cities, particularly in newer subdivisions, and fees can range widely depending on amenities and services included. Some Boulder City neighborhoods may bundle landscaping or shared utilities into HOA fees, while others leave those costs to individual homeowners. Las Vegas’s larger footprint means more variation in fee structures, with some communities offering extensive amenities (pools, fitness centers) and others keeping fees minimal. Renters typically see these costs embedded in rent, while homeowners pay them separately, which affects cash flow predictability.
Tax and fee takeaway: Both cities operate under the same state tax structure, but Boulder City’s higher home values create more property tax exposure for owners. Fee structures vary more by neighborhood and housing type than by city, so households should evaluate HOA costs and service bundles carefully. Renters face indirect tax pressure through rent, while homeowners experience it directly and predictably through annual bills.
Transportation & Commute Reality
Commute patterns in Boulder City and Las Vegas look similar on paper—23 minutes average in Boulder City versus 25 minutes in Las Vegas—but the texture of daily transportation differs in ways that affect time costs, car dependence, and household logistics. Both cities show low work-from-home rates (4.2% in Boulder City, 4.6% in Las Vegas) and high percentages of long commutes (35.8% in Boulder City, 38.1% in Las Vegas), meaning a significant share of workers in both cities face extended drives regardless of average times.
Boulder City’s smaller footprint and position outside the main Las Vegas urban core mean many residents commute into Las Vegas or Henderson for work, which can push individual commute times well above the average depending on job location. The city shows bus service availability but no rail transit, and its walkable pockets (evidenced by pedestrian infrastructure in parts of the city) don’t extend to most residential areas. This creates a car-dependent environment for most households, where daily errands, school drop-offs, and work commutes all require driving. Gas prices are identical ($3.35/gal), so fuel costs don’t differ, but the cumulative time spent in the car—and the friction of managing a household without walkable access to groceries, parks, or services—adds a hidden cost that doesn’t show up in any budget line.
Las Vegas offers more transit options in principle, though car dependence remains high across most neighborhoods. The city’s larger commercial and employment base means more residents can work closer to home, which can reduce commute times and fuel consumption even if average times are similar. The broader geographic spread also means more variation: some neighborhoods offer short commutes and nearby services, while others require long drives for both work and errands. Households prioritizing reduced driving time or proximity to schools and groceries may find more options in Las Vegas, while those willing to trade commute length for lower housing costs may accept Boulder City’s trade-offs.
Transportation takeaway: Commute times are nearly identical, but Boulder City’s smaller scale and position outside the urban core create more car dependence for daily errands and longer drives for households commuting into Las Vegas. Las Vegas offers more geographic variety, which can reduce driving for some households but not all. Both cities require cars for most residents, so the decision hinges more on whether you value proximity to work and services or are willing to absorb more driving in exchange for other benefits.
Cost Structure Comparison
Housing pressure dominates the cost experience in both cities, but it shows up differently depending on whether you’re renting or buying. Boulder City buyers face higher entry barriers due to elevated home values, while Las Vegas renters face higher ongoing monthly obligations. That structural difference shapes which households feel more financial strain: first-time buyers stretching to qualify for a mortgage will find Las Vegas more accessible, while renters managing monthly cash flow may prefer Boulder City’s lower rent—provided they can navigate its smaller rental market.
Utilities introduce identical rate exposure, but Boulder City’s older, larger housing stock amplifies cooling costs for families in single-family homes. Las Vegas offers more variety in housing age and type, which creates opportunities to reduce energy usage through newer construction or smaller units. Households sensitive to utility volatility should prioritize housing type and age over location when evaluating energy costs.
Daily living costs—groceries, errands, and convenience spending—are shaped more by access and friction than by price differences. Boulder City’s sparse grocery density increases time costs and reduces shopping flexibility, which matters most for families managing large volumes or tight budgets. Las Vegas’s broader commercial access lowers friction and enables strategic shopping, but also creates more opportunities for convenience spending that can erode savings if not managed carefully.
Transportation patterns matter more in Boulder City, where car dependence extends to daily errands and most residents commute into Las Vegas for work. Las Vegas offers more geographic variety, which can reduce driving for some households but not all. Both cities require cars for most residents, so the decision is less about whether you need a car and more about how much time you’re willing to spend in it.
The better choice depends on which costs dominate your household. For buyers sensitive to down payment requirements, Las Vegas offers a lower entry threshold. For renters prioritizing monthly cash flow, Boulder City provides lower ongoing housing costs. For families managing grocery logistics and school schedules, Las Vegas’s denser commercial access reduces friction. For households willing to trade convenience for lower rent and a smaller-scale environment, Boulder City’s structure may align better with those priorities.
How the Same Income Feels in Boulder City vs Las Vegas
Single Adult
Housing becomes the first non-negotiable cost, and the difference between Boulder City’s lower rent and Las Vegas’s higher rent shapes how much flexibility remains for other expenses. In Boulder City, the lower monthly rent obligation leaves more room for discretionary spending or savings, but the sparse grocery access and limited dining options mean more time spent driving for errands. In Las Vegas, higher rent tightens the budget upfront, but broader access to groceries, restaurants, and services reduces time costs and creates more opportunities to manage spending strategically. The tradeoff is predictability versus convenience: Boulder City offers more breathing room in the budget but requires more logistical planning, while Las Vegas compresses housing flexibility but simplifies daily errands.
Dual-Income Couple
The primary tension shifts to commute friction and time costs, especially if both partners work in Las Vegas. In Boulder City, lower rent or a lower mortgage payment (if buying in Las Vegas instead) can ease financial pressure, but the longer drives for work and errands consume time that could otherwise go toward meal prep, exercise, or household tasks. In Las Vegas, higher housing costs create more ongoing obligation, but proximity to work and services can reduce driving time and create more schedule flexibility. Couples prioritizing financial cushion may prefer Boulder City’s lower housing costs, while those prioritizing time efficiency and reduced car dependence may find Las Vegas’s density worth the higher rent or mortgage payment.
Family with Kids
Non-negotiable costs expand rapidly to include groceries, school logistics, and healthcare access, and Boulder City’s limited family infrastructure (low school and playground density) creates more friction for households managing multiple schedules. In Boulder City, lower rent or a larger home for the same price can provide more space, but sparse grocery access and limited nearby services mean more driving and more time spent managing errands. In Las Vegas, higher housing costs compress the budget, but denser commercial access and more family-oriented amenities reduce logistical complexity and create more opportunities for quick trips or backup options when plans change. The decision hinges on whether space and lower monthly costs outweigh the time burden of managing a household in a less accessible environment.
Decision Matrix: Which City Fits Which Household?
| Decision factor | If you’re sensitive to this… | Boulder City tends to fit when… | Las Vegas tends to fit when… |
|---|---|---|---|
| Housing entry + space needs | Down payment size, mortgage qualification, or monthly rent obligation | You’re renting and prioritize lower monthly housing costs over proximity to services | You’re buying and need a lower purchase threshold or want more housing variety |
| Transportation dependence + commute friction | Time spent driving, car dependence, or proximity to work | You work remotely or accept longer drives in exchange for lower housing costs | You commute daily and value reduced driving time or proximity to employment centers |
| Utility variability + home size exposure | Cooling costs, home age, or energy efficiency | You’re willing to manage higher cooling costs in older, larger homes for more space | You prioritize newer construction or smaller units that reduce energy usage |
| Grocery strategy + convenience spending creep | Shopping flexibility, time costs, or impulse spending | You plan grocery trips carefully and value lower rent over immediate access to stores | You want more store options, shorter errands, and flexibility to shop strategically |
| Fees + friction costs (HOA, services, upkeep) | Predictability of recurring fees or bundled services | You prefer lower property values and accept variability in fee structures | You want more housing options with varied fee structures and amenity levels |
| Time budget (schedule flexibility, errands, logistics) | Household logistics complexity, school proximity, or service access | You have schedule flexibility and can absorb more driving for daily tasks | You manage multiple schedules and value proximity to schools, groceries, and services |
Lifestyle Fit: Scale, Access, and Daily Rhythm
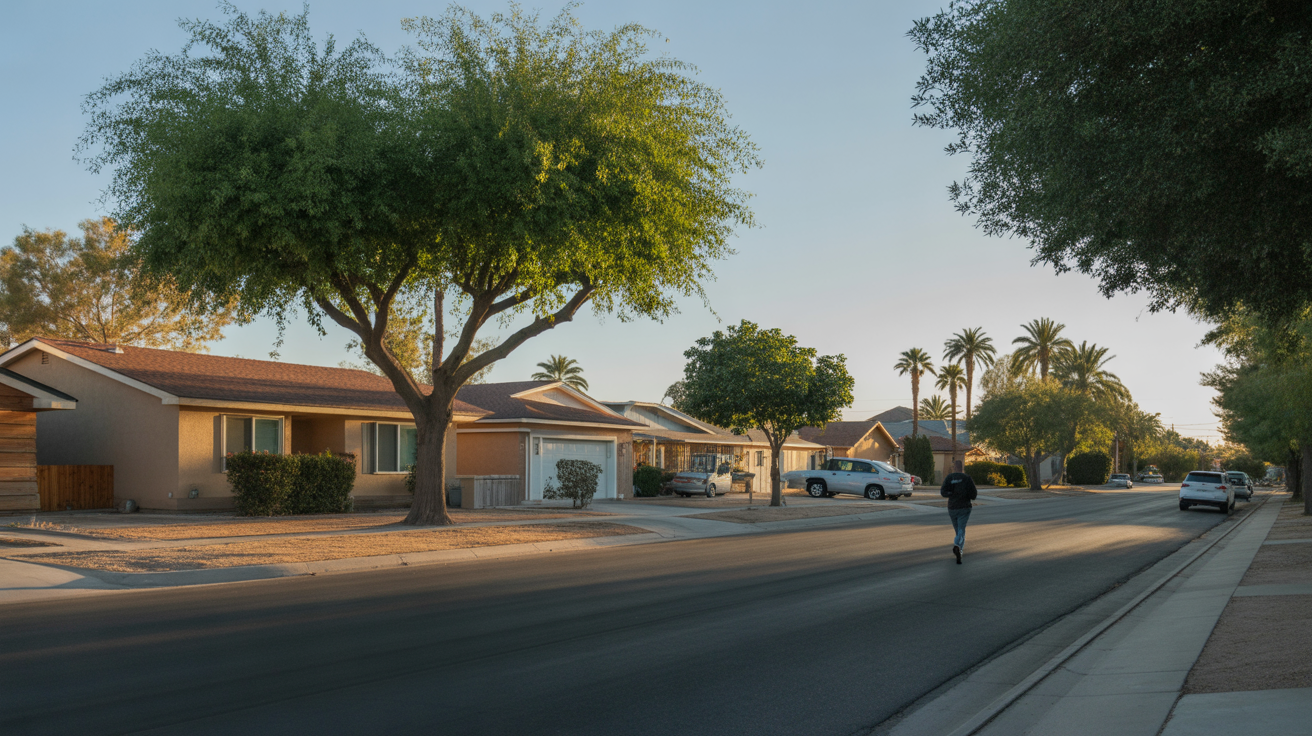
Boulder City and Las Vegas offer fundamentally different lifestyle textures, even though they share the same desert climate and regional amenities. Boulder City operates on a smaller scale, with a low-rise built environment, pockets of walkability, and a quieter, more residential rhythm. The city’s mixed land use (both residential and commercial zones detected) creates some neighborhood-level access to services, but the overall sparse grocery and commercial density means most errands require driving. Families or individuals who value a slower pace, less traffic, and a more tight-knit community feel may find Boulder City’s scale appealing, especially if they’re willing to trade convenience for a less congested environment.
Las Vegas offers a faster, denser urban rhythm with more immediate access to entertainment, dining, shopping, and services. The city’s larger footprint and higher commercial density mean more options within a short drive, which can simplify daily logistics for busy households. Parks, recreation, and outdoor spaces exist in both cities, but Boulder City’s moderate park density and water features (Lake Mead proximity) create a different outdoor experience than Las Vegas’s more developed park system. Households prioritizing outdoor recreation or proximity to natural areas may find Boulder City’s access to Lake Mead and surrounding desert landscapes a meaningful lifestyle benefit, while those prioritizing urban amenities and variety may prefer Las Vegas’s broader offerings.
Commute culture also shapes daily life. Boulder City’s position outside the main Las Vegas urban core means many residents accept longer drives in exchange for a quieter home environment, while Las Vegas residents often prioritize proximity to work and services to minimize time in the car. Both cities show low work-from-home rates, so remote workers are the exception rather than the rule, and most households must factor commute time into their daily schedules. The lifestyle decision hinges on whether you value a smaller-scale, less congested environment with more driving, or a denser, more accessible urban setting with higher housing costs.
Quick facts: Boulder City’s walkable pockets and low-rise character create a suburban feel with some pedestrian-friendly zones, while Las Vegas’s larger scale offers more commercial variety and entertainment options. Boulder City provides routine local healthcare access (clinics present, no hospital), while Las Vegas’s larger footprint supports more specialized medical services.
Frequently Asked Questions
Is Boulder City or Las Vegas cheaper for renters in 2026?
Boulder City shows lower median gross rent at $1,262 per month compared to Las Vegas’s $1,356 per month, which creates less ongoing housing obligation for renters. However, Boulder City’s smaller rental market means fewer available units and less variety, so renters may face more competition or limited options. Las Vegas renters pay more each month but gain access to a broader range of neighborhoods and apartment types, which can simplify the search process and provide more flexibility.
Which city has higher upfront costs for homebuyers, Boulder City or Las Vegas?
Boulder City presents a higher entry barrier for buyers, with a median home value of $401,100 compared to Las Vegas’s $365,300. That difference translates into higher down payment requirements, closing costs, and mortgage qualification hurdles. First-time buyers or households stretching to enter homeownership will find Las Vegas more accessible, while those with more capital or higher incomes may absorb Boulder City’s higher entry costs in exchange for its smaller-scale environment.
Do Boulder City and Las Vegas have different utility costs in 2026?
Both cities share identical electricity rates (13.77¢/kWh) and natural gas prices ($14.46/MCF) because they draw from the same regional providers. Cost exposure differs based on housing type, age, and size rather than location. Families in older, larger single-family homes will face higher cooling costs regardless of city, while those in newer, smaller apartments or townhomes will see more predictable, lower usage. Boulder City’s housing stock skews older and larger, which can amplify energy costs for some households.
How do grocery costs and access compare between Boulder City and Las Vegas in 2026?
Grocery prices are regionally consistent due to the same price parity index, but access and shopping flexibility differ sharply. Boulder City’s sparse grocery density means fewer stores, longer distances between them, and less competition, which increases time costs and reduces opportunities to shop strategically. Las Vegas offers broader grocery access with more store formats and geographic distribution, which lowers friction and enables price-conscious shopping—but also creates more opportunities for convenience spending that can add up over time.
Which city is better for families managing school and errands logistics, Boulder City or Las Vegas?
Las Vegas’s denser commercial access and broader service availability reduce logistical friction for families managing multiple schedules, school pickups, and daily errands. Boulder City shows limited family infrastructure (low school and playground density) and sparse grocery access, which increases driving time and planning burden for households with kids. Families prioritizing proximity to schools, groceries, and services will find Las Vegas easier to navigate, while those willing to absorb more driving in exchange for lower housing costs and a quieter environment may prefer Boulder City’s tradeoffs.
Conclusion
Boulder City and Las Vegas sit in the same metro area and share the same regional price environment, but their cost structures operate on entirely different tracks. Boulder City offers lower rent and a smaller-scale, low-rise environment with pockets of walkability, but its sparse grocery access, limited family infrastructure, and higher home values create friction for renters seeking variety, families managing logistics, and buyers facing steep entry barriers. Las Vegas presents higher rent and more urban density, but its broader commercial access, lower purchase thresholds, and greater housing variety reduce time costs and simplify daily errands for households prioritizing convenience and proximity.
The decision isn’t about which city is cheaper overall—it’s about which cost pressures your household can absorb and which tradeoffs align with how you actually live. Renters prioritizing lower monthly obligations may find Boulder City’s structure appealing, while buyers stretching to qualify for a mortgage will find Las Vegas more accessible. Families managing school schedules and grocery logistics will feel less friction in Las Vegas, while households willing to trade convenience for lower housing costs and a quieter pace may prefer Boulder City’s rhythm. Both cities require cars for most residents, both face the same utility rates, and both operate under Nevada’s tax structure—so the real difference lies in how housing, access, and daily logistics shape your financial and time budget. Choose the city that fits the cost structure you’re best equipped to manage, not the one that promises the lowest total.
How this article was built: In addition to public economic data, this article incorporates location-based experiential signals derived from anonymized geographic patterns—such as access density, walkability, and land-use mix—to reflect how day-to-day living actually feels in Boulder City, NV.