Which city gives you more for your money? Boulder City and Henderson sit just miles apart in the Las Vegas metro, yet the way cost pressure shows up in each place differs in ways that matter for renters, families, and commuters alike. Both cities share the same regional price environment and utility rates, but housing entry barriers, daily errands accessibility, and transportation friction create distinct cost experiences. The better choice in 2026 depends less on total affordability and more on which costs dominate your household—and how predictable or volatile those costs feel month to month.
Boulder City attracts households seeking lower housing entry costs and a quieter, low-rise suburban character. Henderson draws those prioritizing access to services, denser retail corridors, and a retirement-oriented infrastructure. Neither city is universally cheaper; instead, each concentrates cost pressure differently. Renters face lower baseline obligations in Boulder City, while homebuyers confront a smaller down payment barrier. Henderson’s higher housing costs come with trade-offs in convenience and service density that may reduce friction elsewhere. Understanding where your household is most exposed—housing, transportation, or daily logistics—clarifies which city aligns with your financial structure.
This comparison explains how the same income feels different depending on where cost pressure concentrates, how much control you have over variable expenses, and whether your household prioritizes predictability or flexibility. We’ll walk through housing, utilities, groceries, transportation, and fees—not to declare a winner, but to show you where each city’s cost structure fits different household types in 2026.
Housing Costs in Boulder City vs Henderson
Housing represents the largest fixed cost for most households, and the difference between Boulder City and Henderson begins with entry barriers and ongoing obligations. In Boulder City, the median home value stands at $401,100, while Henderson’s median home value reaches $427,900. For renters, Boulder City’s median gross rent sits at $1,262 per month, compared to Henderson’s $1,641 per month. These differences shape not just affordability, but the type of housing pressure each household experiences—whether front-loaded at purchase or distributed across monthly rent checks.
First-time buyers face a lower down payment requirement in Boulder City, reducing the cash barrier to ownership. Henderson’s higher home values demand more upfront capital, which can delay entry for households still building savings. For renters, Boulder City offers a lower baseline monthly obligation, leaving more room for variable expenses like transportation or utilities. Henderson’s higher rent reflects denser service access and newer housing stock in many neighborhoods, but it also means less flexibility when income fluctuates or unexpected costs arise. Families managing tight budgets may find Boulder City’s lower rent creates breathing room, while dual-income households prioritizing convenience may accept Henderson’s higher rent in exchange for shorter errands runs and better retail proximity.
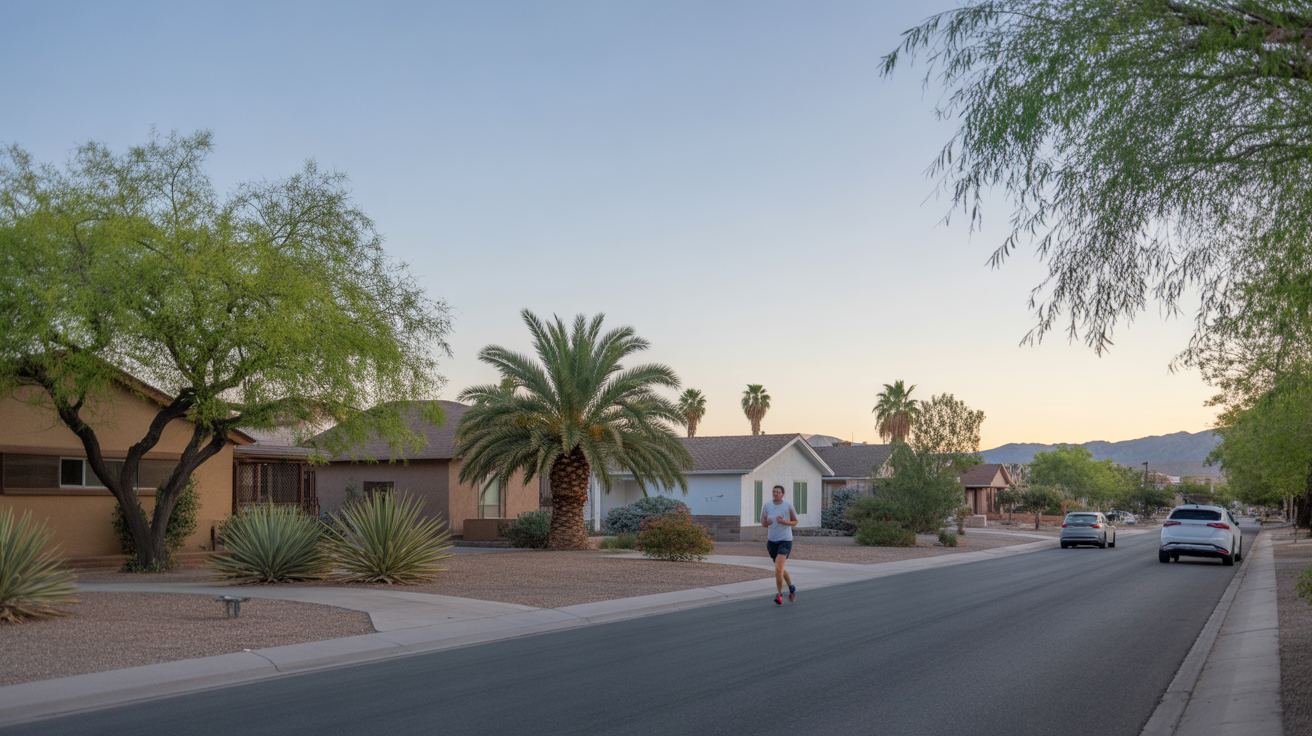
Both cities feature low-rise housing stock, but Boulder City’s experiential signals indicate walkable pockets with higher pedestrian-to-road ratios in certain areas, while Henderson’s urban form remains less defined in available data. Boulder City’s housing market reflects a quieter, more car-oriented suburban layout with limited mixed-use development, meaning housing costs are lower but daily logistics may require more driving. Henderson, designated a retirement city, likely offers more age-friendly housing options and denser service corridors, which can reduce time costs even if rent or mortgage payments run higher. The decision hinges on whether your household prioritizes lower monthly housing obligations or reduced friction in daily errands and services.
| Housing Type | Boulder City | Henderson |
|---|---|---|
| Median Home Value | $401,100 | $427,900 |
| Median Gross Rent | $1,262/month | $1,641/month |
| Entry Barrier (Buyers) | Lower down payment requirement | Higher down payment requirement |
| Monthly Obligation (Renters) | Lower baseline rent | Higher baseline rent |
Housing takeaway: Renters and first-time buyers experience lower entry and ongoing costs in Boulder City, which matters most for households with limited savings or tight monthly budgets. Henderson’s higher housing costs reflect denser service access and likely newer construction, which may reduce utility exposure and errands friction. Households sensitive to upfront cash barriers or monthly rent volatility will find Boulder City more forgiving; those prioritizing convenience and service density may accept Henderson’s higher housing costs as a trade-off for reduced time and transportation friction elsewhere.
Utilities and Energy Costs
Boulder City and Henderson share identical utility rates—13.77¢/kWh for electricity and $14.46/MCF for natural gas—but how those rates translate into monthly bills depends on housing stock, household size, and cooling behavior. Both cities endure extended cooling seasons with triple-digit summer heat, meaning air conditioning dominates utility exposure for most of the year. Heating costs remain minimal, with rare freezing nights requiring only occasional furnace use. The primary difference lies not in rates, but in how housing type, home age, and square footage amplify or dampen seasonal volatility.
Older single-family homes in Boulder City may experience higher cooling costs due to less efficient insulation and larger floor plans, while Henderson’s newer housing stock in many neighborhoods likely offers better thermal performance and lower baseline usage. Apartment renters in both cities benefit from shared walls and smaller square footage, which naturally reduce cooling loads. Families in larger homes face more volatile summer bills, particularly if they occupy older construction with single-pane windows or minimal attic insulation. Dual-income couples in smaller homes or condos experience more predictable utility costs year-round, with less dramatic swings between winter lows and summer peaks.
Utility cost exposure also varies by household behavior. Households that tolerate higher indoor temperatures or shift usage to off-peak hours can reduce summer bills, but this requires schedule flexibility and tolerance for discomfort. Families with young children or elderly residents may prioritize consistent cooling, which increases baseline usage and reduces control over monthly costs. Boulder City’s low-rise housing stock and car-oriented layout mean larger homes are common, which can amplify cooling exposure. Henderson’s denser service corridors and retirement-oriented infrastructure suggest more compact housing options, which may reduce utility volatility for households willing to trade space for predictability.
Utility takeaway: Households in older, larger homes experience more volatile summer utility costs in both cities, but Boulder City’s housing stock may skew toward single-family layouts with higher cooling exposure. Henderson’s newer construction and denser housing options likely offer more predictable utility costs, particularly for retirees or smaller households. The primary driver is housing type and home age, not location—but Boulder City’s lower housing entry costs may push buyers toward older homes with higher utility volatility, while Henderson’s higher housing costs may correlate with newer, more efficient construction.
Groceries and Daily Expenses
Grocery costs in Boulder City and Henderson reflect the same regional price environment, with both cities sharing a Regional Price Parity index of 97, slightly below the national baseline. However, the structure of daily spending differs based on access density, retail mix, and household shopping habits. Boulder City shows sparse food and grocery establishment density, meaning fewer nearby options and longer drives to stock up on staples. Henderson, as a larger and more service-dense city, likely offers broader grocery access with more competitive pricing and shorter trips between home and store.
Households that prioritize bulk shopping and meal planning can manage grocery costs effectively in both cities, but Boulder City’s limited errands accessibility increases the time cost of each shopping trip. Families managing larger grocery volumes may find themselves driving farther or making fewer trips, which can lead to more impulse purchases at convenience stores or higher reliance on prepared foods when fresh ingredients run low. Single adults and couples with flexible schedules may adapt more easily, planning weekly trips to big-box stores and minimizing mid-week errands. Henderson’s denser retail corridors reduce this friction, making it easier to grab missing ingredients or compare prices across multiple stores without adding significant drive time.
Dining out and convenience spending also differ structurally. Boulder City’s quieter, less commercial character means fewer casual dining options and coffee shops within walking distance, which can reduce temptation spending but also limit social and convenience options. Henderson’s broader service infrastructure supports more frequent dining out, takeout, and coffee runs, which can add up for households that value convenience over cooking. Families with young children may find Boulder City’s limited dining options reduce spending creep, while dual-income couples in Henderson may accept higher convenience spending in exchange for time savings and reduced meal-planning friction.
Groceries takeaway: Households sensitive to time costs and errands friction will feel Boulder City’s sparse grocery density more acutely, particularly families managing larger volumes or frequent mid-week trips. Henderson’s denser retail access reduces drive time and increases price competition, which matters most for households that shop frequently or value convenience. The price difference is minimal, but the access difference is structural—Boulder City requires more planning and longer drives, while Henderson offers more flexibility and shorter errands loops.
Taxes and Fees
Nevada imposes no state income tax, which benefits all households in both Boulder City and Henderson equally. However, property taxes, sales taxes, and local fees create differences in ongoing obligations and predictability. Property taxes in both cities are assessed at the county level, meaning homeowners face similar effective rates, but the higher home values in Henderson translate to higher absolute property tax bills. Renters don’t pay property taxes directly, but landlords typically pass through a portion of that cost in monthly rent, which partially explains Henderson’s higher baseline rent obligations.
Sales taxes apply to most goods and services in both cities, with Nevada’s statewide base rate supplemented by local add-ons. Households that spend more on taxable goods—furniture, electronics, dining out—will feel this more acutely, but the rate structure is consistent across the metro. The primary difference lies in how predictable these costs are. Property taxes for homeowners are fixed and knowable, while sales taxes fluctuate with spending behavior. Renters avoid direct property tax exposure but face less control over rent increases, which can absorb landlord cost changes including property tax adjustments.
Local fees for utilities, trash collection, and water vary by provider and housing type. Single-family homeowners in both cities typically pay these fees separately, while apartment renters may see some services bundled into rent. HOA fees are common in newer developments, particularly in Henderson’s master-planned communities, and can range from minimal to substantial depending on amenities and shared services. Boulder City’s older housing stock and less dense development patterns mean fewer HOA-governed neighborhoods, which reduces predictable monthly fees but may increase individual maintenance costs. Households planning to stay long-term should weigh whether they prefer bundled, predictable HOA fees or more control over maintenance spending with higher variability.
Taxes and fees takeaway: Homeowners in Henderson face higher property tax bills due to higher home values, but renters in both cities experience similar sales tax exposure. HOA fees are more common in Henderson’s newer developments, which increases predictability but reduces flexibility. Boulder City’s older housing stock and lower home values reduce property tax obligations for owners, but may increase individual maintenance and upkeep costs. Households sensitive to predictable monthly fees may prefer Henderson’s bundled HOA structures; those prioritizing control and lower baseline obligations may prefer Boulder City’s less regulated housing stock.
Transportation & Commute Reality
Transportation costs in Boulder City and Henderson differ primarily in commute friction and daily errands accessibility, not fuel prices. Boulder City’s gas price sits at $3.35/gal, while Henderson’s is $3.38/gal—a negligible difference that doesn’t change household budgets. What does matter is how far and how often you drive. Boulder City shows an average commute time of 23 minutes, with only 4.2% of workers working from home and 35.8% facing long commutes. These figures suggest a car-dependent workforce with limited flexibility to avoid peak-hour driving or reduce vehicle reliance.
Boulder City’s experiential signals reveal sparse food and grocery density, meaning most errands require driving. Even with walkable pockets in certain neighborhoods, the overall city structure is car-oriented, with low daily errands accessibility. Bus service is present, but the city lacks rail transit, and the pedestrian-to-road ratio suggests limited practical alternatives to driving for most daily tasks. Households that rely on a single vehicle may find this manageable, but families juggling multiple schedules or single adults without flexible work arrangements will feel the time cost of frequent driving more acutely.
Henderson lacks specific commute data in the available feed, but as a larger, more service-dense city with retirement-oriented infrastructure, it likely offers shorter errands loops and better retail proximity. This doesn’t eliminate car dependence, but it reduces the frequency and distance of daily trips. Households in Henderson may still drive for work, but grocery runs, pharmacy visits, and routine errands are likely more clustered and accessible. For families managing school drop-offs, after-school activities, and weekend errands, this structural difference can reduce both fuel costs and time friction, even if the per-gallon price is nearly identical.
Transportation takeaway: Boulder City’s moderate commute time and sparse errands accessibility increase car dependence and time costs, particularly for households managing multiple daily trips. Henderson’s denser service corridors likely reduce errands friction, even if commute patterns remain car-reliant. Households sensitive to time costs and schedule complexity may find Henderson’s structure more forgiving, while those with simple commutes and tolerance for longer errands drives may accept Boulder City’s lower housing costs as a trade-off.
Cost Structure Comparison
Housing dominates the cost experience in both cities, but the nature of that pressure differs. Boulder City concentrates cost savings in lower rent and home values, which matters most for renters and first-time buyers with limited upfront capital or tight monthly budgets. Henderson’s higher housing costs reflect denser service access, likely newer construction, and a retirement-oriented infrastructure that reduces friction in daily errands and healthcare access. Households sensitive to housing entry barriers or monthly rent volatility will find Boulder City more forgiving; those prioritizing convenience and reduced time costs may accept Henderson’s higher housing obligations as a trade-off for better service density.
Utilities introduce similar seasonal volatility in both cities due to identical rates and shared desert climate exposure. However, Boulder City’s older housing stock and low-rise, car-oriented layout may push households toward larger single-family homes with higher cooling exposure. Henderson’s newer construction and denser housing options likely offer more predictable utility costs, particularly for retirees or smaller households willing to trade space for efficiency. The difference is less about rates and more about housing stock and household behavior—older homes amplify volatility, while newer, compact homes dampen it.
Daily living costs—groceries, dining, and convenience spending—differ structurally based on access density. Boulder City’s sparse food and grocery establishment density increases the time cost of errands, requiring more planning and longer drives. Henderson’s denser retail corridors reduce this friction, making it easier to compare prices, grab missing items, and manage frequent shopping trips without adding significant drive time. Families managing larger grocery volumes or households with limited schedule flexibility will feel Boulder City’s access gaps more acutely, while those who plan weekly bulk trips may find the lower housing costs offset the added errands friction.
Transportation patterns matter more in Boulder City, where sparse errands accessibility and moderate commute times create higher car dependence and time costs. Henderson’s denser service infrastructure likely reduces daily driving frequency, even if commute patterns remain car-reliant. For households juggling multiple schedules, school drop-offs, or frequent errands, this structural difference can reduce both fuel costs and time friction. Single adults with simple commutes and tolerance for longer drives may find Boulder City’s lower housing costs a better fit, while families managing complex logistics may prefer Henderson’s reduced errands friction.
The better choice depends on which costs dominate your household. Households sensitive to housing entry barriers, monthly rent obligations, or upfront cash requirements may prefer Boulder City’s lower baseline costs. Those prioritizing service density, reduced errands friction, and predictable utility exposure may accept Henderson’s higher housing costs as a trade-off for better access and newer construction. Neither city is universally cheaper—each concentrates cost pressure differently, and the right fit depends on whether your household values lower fixed costs or reduced time and logistics friction.
How the Same Income Feels in Boulder City vs Henderson
Single Adult
For a single adult, housing becomes the first non-negotiable cost, and Boulder City’s lower rent creates more flexibility for transportation, dining, and discretionary spending. Henderson’s higher rent absorbs more of each paycheck upfront, leaving less room for variable expenses or unexpected costs. Commute friction matters more in Boulder City, where sparse errands accessibility and limited work-from-home options increase car dependence and time costs. Flexibility exists in grocery planning and convenience spending, but the need to drive for most errands reduces control over time budgets. Henderson’s denser service corridors reduce errands friction, making it easier to manage daily logistics without adding significant drive time, but the higher rent obligation limits financial flexibility when income fluctuates.
Dual-Income Couple
For a dual-income couple, housing entry costs and ongoing rent obligations shape financial stability differently in each city. Boulder City’s lower home values reduce the down payment barrier, making ownership more accessible for couples building savings. Henderson’s higher housing costs delay entry but may offer newer construction with lower utility exposure and reduced maintenance friction. Flexibility exists in both cities for managing grocery costs and dining out, but Boulder City’s sparse errands accessibility increases the time cost of routine trips, which matters more for couples juggling two work schedules. Henderson’s denser retail access reduces this friction, allowing more frequent, shorter errands loops that fit around work commitments. The role of commute friction differs—Boulder City’s moderate commute time and low work-from-home share suggest limited flexibility to avoid peak-hour driving, while Henderson’s service density may reduce non-commute driving even if work trips remain car-reliant.
Family with Kids
For families, housing space needs and daily logistics complexity dominate the cost experience. Boulder City’s lower home values and rent create more room in the budget for larger homes, but the sparse family infrastructure—limited school and playground density—increases the time cost of managing school drop-offs, after-school activities, and weekend errands. Flexibility disappears when juggling multiple schedules, and the car-oriented layout means most trips require driving. Henderson’s higher housing costs absorb more of the budget upfront, but the retirement-oriented infrastructure likely offers better healthcare access and denser service corridors, which reduce errands friction and time costs. The role of housing form matters—Boulder City’s low-rise, single-family stock may offer more space per dollar, but older homes increase utility volatility and maintenance exposure. Henderson’s newer construction and denser housing options may reduce utility costs and upkeep friction, even if monthly housing obligations run higher. Families sensitive to time costs and logistics complexity may find Henderson’s structure more forgiving, while those prioritizing space and lower housing entry costs may accept Boulder City’s added errands friction.
Decision Matrix: Which City Fits Which Household?
| Decision Factor | If You’re Sensitive to This… | Boulder City Tends to Fit When… | Henderson Tends to Fit When… |
|---|---|---|---|
| Housing entry + space needs | Upfront cash barriers, monthly rent obligations, or down payment requirements | You prioritize lower entry costs and larger homes per dollar, even if housing stock is older | You value newer construction and predictable utility exposure, even if housing costs are higher |
| Transportation dependence + commute friction | Time costs, car dependence, or schedule flexibility | You have a simple commute and tolerate longer errands drives in exchange for lower housing costs | You juggle multiple schedules and value shorter errands loops, even if commute patterns remain car-reliant |
| Utility variability + home size exposure | Seasonal bill volatility, cooling costs, or home age | You accept higher cooling exposure in older, larger homes in exchange for lower housing entry costs | You prioritize predictable utility costs in newer, more efficient construction, even if rent or mortgage is higher |
| Grocery strategy + convenience spending creep | Errands accessibility, time costs, or retail proximity | You plan weekly bulk trips and tolerate sparse grocery density in exchange for lower housing costs | You value frequent, shorter shopping trips and denser retail access, even if housing costs are higher |
| Fees + friction costs (HOA, services, upkeep) | Predictable monthly fees, maintenance control, or bundled services | You prefer lower baseline fees and more control over maintenance, even if costs are less predictable | You value bundled HOA services and predictable monthly fees, even if total obligations are higher |
| Time budget (schedule flexibility, errands, logistics) | Daily logistics complexity, errands friction, or household coordination | You have simple schedules and tolerate longer drives for errands in exchange for lower housing costs | You manage complex schedules and value reduced errands friction, even if housing costs are higher |
Lifestyle Fit
Boulder City and Henderson offer distinct lifestyle textures shaped by urban form, service density, and household composition. Boulder City’s low-rise character and walkable pockets in certain neighborhoods create a quieter, more residential feel, but the overall city structure remains car-oriented with limited mixed-use development. Bus service is present, but the lack of rail transit and sparse daily errands accessibility mean most households rely on personal vehicles for commuting, grocery shopping, and routine errands. The moderate commute time of 23 minutes suggests manageable work trips, but the high share of long commutes—35.8%—indicates that many residents face extended drives, particularly those working in Las Vegas or other metro areas. For households that value space, lower housing costs, and a slower pace, Boulder City fits well, but the limited family infrastructure and sparse service density increase the time cost of managing daily logistics.
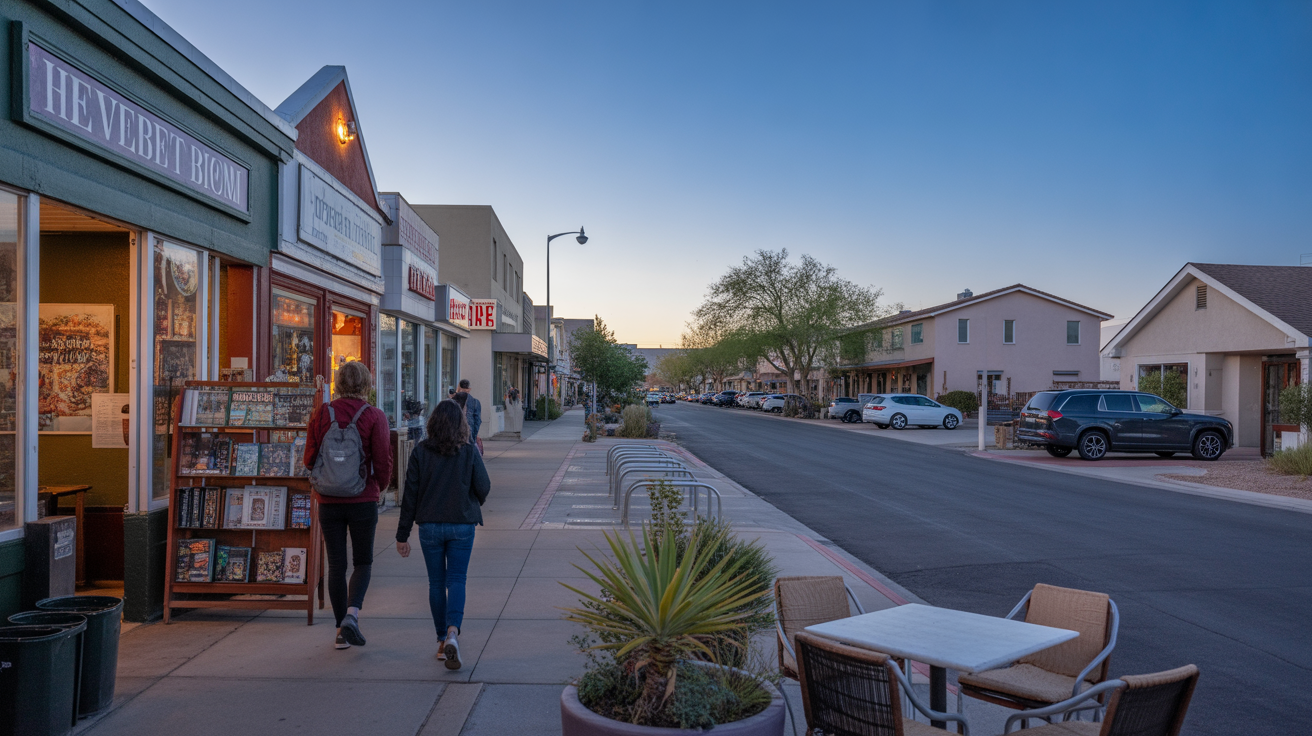
Henderson’s larger size and retirement-oriented infrastructure create a more service-dense environment with better healthcare access and likely more clustered retail corridors. The city’s designation as a retirement destination suggests age-friendly amenities, denser pharmacy and clinic access, and housing options designed for smaller households or retirees prioritizing convenience over space. While specific commute data is unavailable, Henderson’s denser service corridors likely reduce the frequency and distance of daily errands trips, which matters for families managing school drop-offs, after-school activities, and weekend errands. The higher housing costs reflect this convenience, but households willing to accept smaller homes or higher rent may find the reduced time friction worth the trade-off. For dual-income couples, retirees, or families prioritizing service access over space, Henderson’s structure aligns better with daily routines.
Outdoor access and recreation differ subtly between the two cities. Boulder City shows moderate park density and water features, which provide some green space access, but the overall outdoor infrastructure remains limited compared to larger metro areas. Henderson’s size and service density likely offer more varied recreation options, including community centers, walking trails, and organized activities, though specific data is unavailable. Both cities endure triple-digit summer heat, which limits outdoor activity during peak months and increases reliance on indoor recreation and air-conditioned spaces. Households that prioritize outdoor recreation year-round may find both cities challenging during summer, but Henderson’s denser service infrastructure may offer more indoor alternatives like gyms, pools, and community programs.
Boulder City’s average commute time: 23 minutes. Henderson’s median household income: $85,311 per year.
Frequently Asked Questions
Is Boulder City or Henderson cheaper for renters in 2026?
Boulder City offers lower baseline rent obligations, with median gross rent at $1,262 per month compared to Henderson’s $1,641 per month. This difference matters most for renters with tight monthly budgets or limited income flexibility. However, Henderson’s higher rent reflects denser service access and likely newer housing stock, which may reduce utility exposure and errands friction. Renters sensitive to monthly cash flow will find Boulder City more forgiving, while those prioritizing convenience and reduced time costs may accept Henderson’s higher rent as a trade-off for better service density.
Which city has lower housing entry costs for first-time buyers in 2026?
Boulder City’s median home value of $401,100 creates a lower down payment barrier compared to Henderson’s $427,900. For first-time buyers building savings or managing tight budgets, this difference reduces the upfront cash requirement and makes ownership more accessible. However, Boulder City’s older housing stock may increase utility volatility and maintenance costs, while Henderson’s higher home values may correlate with newer construction and lower ongoing upkeep. Buyers should weigh whether they prioritize lower entry costs or reduced long-term maintenance friction.
How do transportation costs differ between Boulder City and Henderson in 2026?
Gas prices are nearly identical—$3.35/gal in Boulder City and $3.38/gal in Henderson—so fuel costs don’t drive the difference. What matters is how far and how often you drive. Boulder City shows sparse food and grocery density, meaning most errands require driving, and the moderate commute time of 23 minutes suggests car dependence for work trips. Henderson’s denser service corridors likely reduce errands friction, allowing shorter, more clustered trips even if commute patterns remain car-reliant. Households juggling multiple schedules or frequent errands will feel Boulder City’s access gaps more acutely, while those with simple commutes may find the lower housing costs offset the added drive time.
Do utilities cost more in Boulder City or Henderson in 2026?
Both cities share identical utility rates—13.77¢/kWh for electricity and $14.46/MCF for natural gas—so the difference lies in housing stock and household behavior, not rates. Boulder City’s older, low-rise housing stock may increase cooling exposure during triple-digit summer heat, particularly in larger single-family homes. Henderson’s newer construction and denser housing options likely offer better thermal performance and lower baseline usage. Families in older, larger homes will experience more volatile summer bills in both cities, but Henderson’s housing stock may skew toward more efficient construction, reducing utility exposure for households willing to trade space for predictability.
Which city is better for families managing daily errands and school logistics in 2026?
Henderson’s denser service corridors and retirement-oriented infrastructure likely reduce errands friction, making it easier to manage grocery runs, pharmacy visits, and routine trips without adding significant drive time. Boulder City shows sparse food and grocery density and limited family infrastructure, meaning most errands require longer drives and more planning. Families juggling school drop-offs, after-school activities, and weekend errands will feel Boulder City’s access gaps more acutely, while those with simple schedules and tolerance for longer drives may find the lower housing costs a better fit. The decision hinges on whether your household prioritizes lower housing entry costs or reduced time and logistics friction.
Conclusion
Boulder City and Henderson sit in the same metro, share identical utility rates, and face the same desert climate exposure, yet the way cost pressure shows up in each city differs in ways that matter for renters, families, and commuters. Boulder City concentrates cost savings in lower housing entry barriers and monthly rent obligations, which matters most for households with limited upfront capital or tight budgets. Henderson’s higher housing costs reflect denser service access, likely newer construction, and a retirement-oriented infrastructure that reduces errands friction and time costs. Neither city is universally cheaper—each concentrates cost pressure differently, and the right fit depends on which costs dominate your household and whether you prioritize lower fixed obligations or reduced logistics friction.
For renters and first-time buyers, Boulder City offers lower baseline costs and easier entry, but the sparse errands accessibility and limited family infrastructure increase the time cost of daily logistics. Henderson’s higher housing costs come with better service density, shorter errands loops, and likely more predictable utility exposure in newer construction. Families managing complex schedules, dual-income couples juggling multiple commitments, and retirees prioritizing healthcare access may find Henderson’s structure more forgiving, even if housing costs run higher. Single adults with simple commutes, households that tolerate longer errands drives, and buyers prioritizing space over convenience may find Boulder City’s lower housing costs a better fit. The decision isn’t about which city is cheaper overall