Moving from San Francisco to Austin represents one of the most common relocation corridors in the United States, driven by housing cost relief, job market shifts, and lifestyle recalibration. But this move doesn’t simply make everything cheaper—it redistributes where costs concentrate, how daily logistics unfold, and which household expenses demand the most attention.
San Francisco’s median home value sits at $1,348,700, while Austin’s stands at $461,500. Median rent drops from $2,316 per month to $1,549 per month. These differences reshape household budgets immediately, but they don’t eliminate financial pressure—they redirect it. Understanding where costs move, not just how much they fall, determines whether this relocation delivers the relief people expect.
This guide explains how cost behavior, daily rhythms, and logistical patterns shift between these two cities. It does not calculate savings, predict affordability, or declare a financial winner. Instead, it clarifies where pressure increases, where it decreases, and who tends to feel each change most acutely.
Where Cost Pressure Concentrates Differently
The most visible cost shift involves housing entry barriers. San Francisco’s median home value creates a formidable obstacle to ownership, while Austin’s lower entry point makes homeownership accessible to households who would remain renters indefinitely in the Bay Area. For renters, the monthly obligation drops substantially, though Austin’s rental market has tightened considerably in recent years, reducing the gap between the two cities compared to a decade ago.
But housing relief comes with tradeoffs elsewhere. Transportation costs behave differently in Austin, where car dependence is more pronounced. While San Francisco offers rail transit and substantial pedestrian infrastructure in walkable pockets, Austin’s urban form leans more heavily on driving for daily errands, commuting, and household logistics. Gas prices reflect this difference: $4.34 per gallon in San Francisco versus $2.47 per gallon in Austin. The lower per-gallon cost doesn’t eliminate transportation expense—it shifts the cost structure from transit passes and occasional ride-sharing to regular fuel purchases, insurance, maintenance, and vehicle ownership.
Utility exposure changes as well, though not always in the direction people expect. Electricity rates drop from 31.91¢ per kWh in San Francisco to 16.04¢ per kWh in Austin, but Austin’s extended cooling season and triple-digit summer heat drive higher consumption. Air conditioning dominates summer bills in Austin in a way that rarely occurs in San Francisco’s mild coastal climate. Natural gas pricing moves in the opposite direction—$21.94 per MCF in San Francisco versus $30.71 per MCF in Austin—but heating demand remains modest in both cities, so this difference rarely drives household budgets.
Grocery costs show minimal variation between the two cities. Derived estimates suggest bread costs around $1.83 per pound in San Francisco and $1.80 per pound in Austin; ground beef runs approximately $6.69 per pound in San Francisco and $6.55 per pound in Austin. These figures reflect regional price parity adjustments rather than observed local prices, but they indicate that food costs do not represent a major source of relief or new pressure in this move.
Income dynamics shift as well. San Francisco’s median household income of $136,689 per year drops to $86,556 per year in Austin. For remote workers maintaining Bay Area salaries, this income gap creates significant purchasing power gains. For those changing employers or industries, the income adjustment may offset much of the housing savings, particularly in Austin’s competitive tech and professional services sectors.
Housing Market Behavior and Neighborhood Form
San Francisco’s housing market operates under extreme supply constraints, with limited buildable land, strict zoning, and high construction costs. This creates a market where entry barriers dominate—getting in is the hardest part, but once established, rent-controlled units or fixed-rate mortgages can provide relative stability. Austin’s housing market, by contrast, has experienced rapid growth and development, with more construction activity and fewer geographic constraints. Entry costs are lower, but the market remains volatile, with rent increases and property tax adjustments creating ongoing pressure.
Neighborhood form affects daily costs in ways that extend beyond rent or mortgage payments. San Francisco’s density, mixed land use, and transit infrastructure allow many households to reduce or eliminate car ownership. Errands, healthcare, and social activities often cluster within walking distance or a short transit ride. Austin’s urban form, while increasingly dense in central neighborhoods, still requires most households to own at least one vehicle. Parking, insurance, and maintenance costs become baseline household expenses rather than optional conveniences.
For renters, Austin’s market offers more space per dollar, but less protection from annual rent adjustments. San Francisco’s rent control policies, while not universal, provide stability for many long-term tenants. Austin’s rental market operates with fewer restrictions, meaning landlords can adjust rents more freely in response to market conditions. This creates a different kind of exposure—less upfront cost, but more year-to-year uncertainty.
For buyers, Austin’s lower home prices make ownership feasible earlier in a household’s financial timeline, but property taxes in Texas are higher than in California due to the absence of state income tax. Ongoing ownership costs—taxes, insurance, and maintenance—require more attention in Austin, while San Francisco’s ownership challenge concentrates at the point of purchase.
Daily Rhythms, Commute Patterns, and Lifestyle Texture
San Francisco’s average commute time of 31 minutes drops to 24 minutes in Austin, but this comparison masks important differences in how people move through their day. San Francisco’s commute time often includes walking, waiting for transit, and transfers, while Austin’s shorter average reflects direct car commutes on highways and arterial roads. The experience of commuting changes more than the clock time suggests.
In addition to public economic data, this article incorporates location-based experiential signals derived from anonymized geographic patterns—such as access density, walkability, and land-use mix—to reflect how day-to-day living actually feels in Austin, TX. Austin shows notable cycling infrastructure throughout parts of the city, with bike-to-road ratios exceeding high thresholds. Rail transit service is present, and food and grocery establishment density is broadly accessible, with both categories exceeding high-density thresholds. Park density is integrated throughout the city, with water features present. The urban form leans more vertical, with average building levels exceeding high thresholds, and both residential and commercial land use are detected in mixed patterns. These patterns suggest that while Austin requires car ownership for many households, central neighborhoods offer walkable errands, accessible green space, and transit options that reduce daily car dependence for those who prioritize proximity to these amenities.
Climate exposure shifts dramatically. San Francisco’s cool, foggy summers and mild winters create minimal heating or cooling demand. Austin’s long, hot summers and brief but occasionally freezing winter nights require both air conditioning and occasional heating. This affects not just utility bills, but daily routines—outdoor activities shift to early mornings and evenings in summer, and indoor spaces require climate control for comfort most of the year.
Social and recreational patterns change as well. San Francisco’s density and transit access support spontaneous social activity and cultural engagement without logistical planning. Austin’s sprawl and car dependence require more intentional coordination—meeting friends, attending events, or running errands involves driving, parking, and time management in ways that feel different from San Francisco’s walkable neighborhoods.
Work-from-home patterns differ as well. San Francisco reports 12.8% of workers primarily working from home, while Austin shows 4.8%. This may reflect industry composition, employer policies, or housing configurations that support or discourage remote work. For remote workers relocating from San Francisco, Austin’s lower housing costs can provide more space for dedicated home offices, but the car-dependent lifestyle may feel isolating for those accustomed to working from cafes, co-working spaces, or transit-accessible offices.
Relocation Logistics and Adjustment Friction
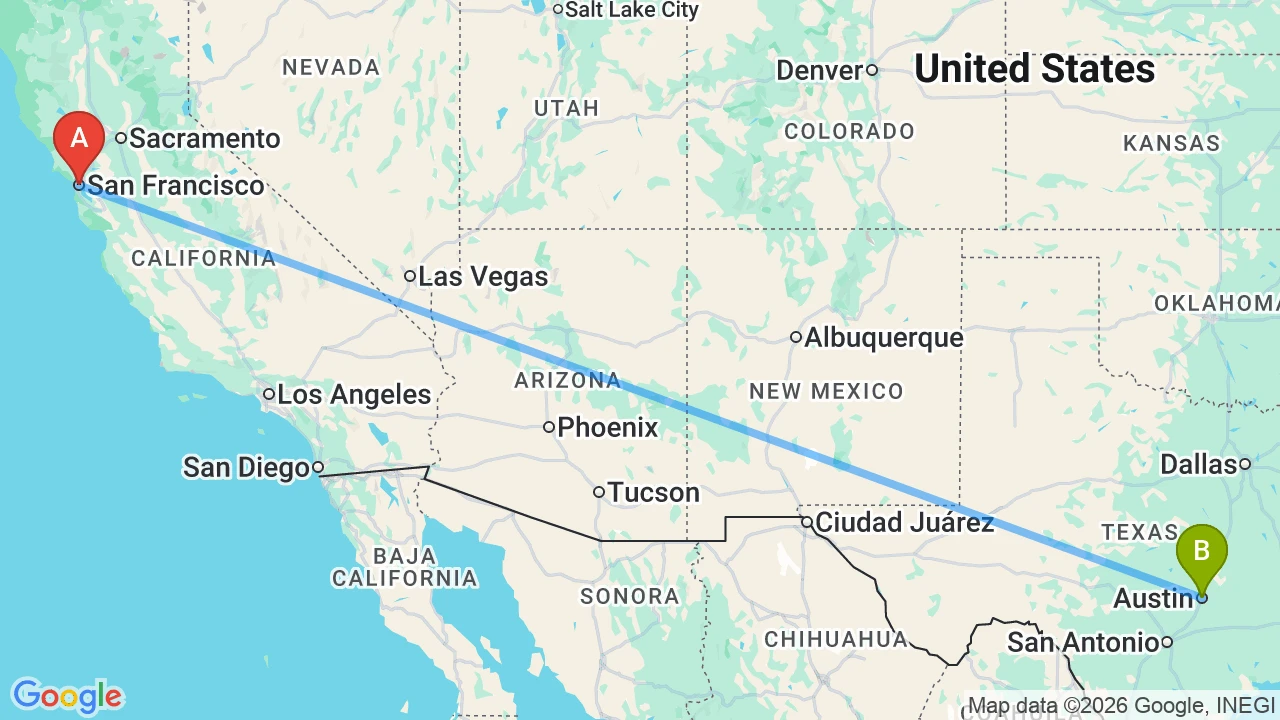
The physical move from San Francisco to Austin involves roughly 1,700 miles, typically requiring professional movers, vehicle shipping, or a multi-day drive. Moving costs vary widely based on household size, timing, and service level, but the distance alone ensures this is not a quick or inexpensive transition. For renters, lease timing in both cities can create overlap costs—breaking a San Francisco lease early or securing an Austin apartment before arrival adds financial and logistical complexity.
Establishing residency in Texas involves vehicle registration, driver’s license updates, and voter registration. Texas requires vehicle inspections and imposes sales tax on vehicles brought from out of state, adding upfront costs that many relocators overlook. For homebuyers, closing timelines, inspection requirements, and title processes differ between California and Texas, requiring attention to local norms and legal requirements.
Social adjustment varies by household. Families with school-age children face mid-year enrollment challenges if the move doesn’t align with academic calendars. Austin’s strong family infrastructure—with school and playground density in moderate ranges—supports family life, but finding the right neighborhood and school fit requires research and often multiple visits. For young professionals, Austin’s college-town energy and growing tech sector create social opportunities, but building new networks takes time and intentional effort.
Healthcare access shifts as well. San Francisco’s hospital and clinic density provides immediate access to specialized care, while Austin’s healthcare infrastructure, though robust, may require longer travel times for certain specialties or providers. For households managing chronic conditions or requiring regular medical appointments, understanding Austin’s healthcare landscape before the move reduces post-relocation stress.
Frequently Asked Questions
- Does Austin feel more or less expensive than San Francisco?
- Austin feels less expensive for housing, but cost pressure redistributes rather than disappears. Transportation costs rise due to car dependence, utility bills spike in summer due to air conditioning, and income adjustments may offset housing savings. Households maintaining Bay Area salaries experience the most relief, while those changing employers may find the cost difference less dramatic than expected.
- How do housing markets differ between San Francisco and Austin?
- San Francisco’s market is defined by extreme entry barriers and relative stability once established, while Austin’s market offers lower entry costs but more year-to-year volatility. San Francisco renters often benefit from rent control, while Austin renters face fewer protections and more frequent rent adjustments. Homeownership is accessible earlier in Austin, but ongoing property taxes and insurance costs require more attention than in California.
- What feels different about daily life after moving to Austin?
- Daily life in Austin revolves more around driving, with errands, commutes, and social activities requiring car trips and parking logistics. Climate exposure increases dramatically, with long, hot summers requiring air conditioning and shifting outdoor routines to early mornings and evenings. The pace feels less dense and more spread out, with more space per household but less spontaneous walkable activity.
- When does the move from San Francisco to Austin feel easiest?
- Timing the move to avoid Austin’s peak summer heat makes the physical transition and initial adjustment more comfortable. Aligning the move with lease cycles, school calendars, or job start dates reduces overlap costs and logistical friction. Visiting Austin multiple times before committing helps households understand neighborhood tradeoffs and identify the right fit before signing a lease or making an offer.
- What challenges surprise people most after moving to Austin?
- Car dependence surprises many relocators, particularly those accustomed to San Francisco’s transit and walkable neighborhoods. Summer heat and air conditioning costs catch households off guard, especially those underestimating how much cooling drives utility bills. Property tax bills and vehicle registration costs create unexpected expenses, and the social adjustment—building new networks and routines—takes longer than many anticipate.
- Who does this move work best for?
- This move works best for remote workers maintaining Bay Area salaries, families seeking homeownership and more space, and professionals in Austin’s growing tech and business sectors. It challenges households who rely on transit, prefer walkable urban density, or need specialized healthcare access. Those who thrive in car-dependent environments and tolerate intense summer heat adjust most easily, while those who value spontaneous walkability and mild climates may feel the lifestyle shift more acutely.
Understanding the Full Picture
Moving from San Francisco to Austin delivers significant housing cost relief for most households, but it does not eliminate financial pressure—it redirects it. Transportation, utilities, and ongoing housing obligations require more attention in Austin, while income adjustments and lifestyle changes affect how much relief households actually experience. The move works best for those who prioritize homeownership, space, and car-based lifestyles, and it challenges those who value walkability, transit access, and mild climates.
For deeper exploration of Austin’s cost drivers, neighborhood patterns, and household budgets, visit the Austin local living guide. For broader metro-area context and suburb comparisons, see the Austin metro overview. These resources provide the detail needed to move from general understanding to specific decision-making.
How this article was built: In addition to public economic data, this article incorporates location-based experiential signals derived from anonymized geographic patterns—such as access density, walkability, and land-use mix—to reflect how day-to-day living actually feels in Austin, TX.