Campbell median rent: $2,619/month | Sunnyvale median rent: $2,990/month
Campbell median home value: $1,473,700 | Sunnyvale median home value: $1,680,700
Campbell median household income: $141,794/year | Sunnyvale median household income: $174,506/year
Campbell and Sunnyvale sit minutes apart in Silicon Valley, share the same utility infrastructure, and face the same regional price pressures—yet the cost experience in each city feels fundamentally different in 2026. The distinction isn’t just about housing entry barriers or commute minutes. It’s about how place structure shapes daily logistics, where flexibility exists, and which households can absorb front-loaded costs versus ongoing exposure. Families weighing school quality against walkability, couples prioritizing commute predictability over neighborhood texture, and single professionals deciding whether car ownership is negotiable all face different tradeoffs depending on which city they choose.
Both cities demand high incomes by national standards, but the income required to feel stable—not just survive—diverges based on how transportation dependence, housing form, and daily errands friction interact. Campbell’s documented infrastructure reduces some ongoing costs while concentrating pressure at the entry point. Sunnyvale’s higher income baseline suggests a different household composition, but without the same visibility into how people actually move through the city day-to-day, the comparison hinges on what each household can’t compromise on. This isn’t about finding the “cheaper” option. It’s about understanding where cost pressure shows up, how predictable it is, and which household types absorb it most easily.
The decision between Campbell and Sunnyvale in 2026 comes down to whether your household is more exposed to housing entry barriers, ongoing transportation friction, or the cumulative weight of daily logistics. The right choice depends entirely on which costs dominate your financial and time budget—and how much control you have over each.
Housing Costs: Entry Barriers and Ongoing Obligations
Campbell’s median home value sits at $1,473,700, while Sunnyvale’s reaches $1,680,700. For renters, Campbell’s median gross rent is $2,619 per month compared to Sunnyvale’s $2,990. These aren’t minor differences—they represent distinct entry thresholds and ongoing obligations that shape which households can access each city and how much flexibility remains after housing costs are covered. The gap matters most for households where housing dominates the budget, where saving for a down payment determines timeline, or where monthly rent leaves little room for volatility in other categories.
Campbell’s lower entry point benefits first-time buyers stretching toward ownership and renters managing single or early dual incomes. The difference in rent—$371 per month—creates breathing room for households sensitive to transportation costs, childcare, or irregular expenses. Sunnyvale’s higher threshold suggests a market oriented toward established dual-income households or individuals in high-compensation tech roles where the income baseline of $174,506 per year (compared to Campbell’s $141,794) reflects the resident composition rather than a cost-of-living adjustment. The housing cost gap isn’t just about affordability in isolation—it’s about how much income is left to absorb other fixed costs and whether the household can sustain housing payments during income disruptions.
For families, Campbell’s lower housing entry pairs with strong school density and integrated parks, meaning the housing cost doesn’t come with a tradeoff in family infrastructure. Sunnyvale’s higher housing cost may reflect proximity to specific employers or school district preferences, but without clear visibility into neighborhood walkability or errands accessibility, the premium hinges entirely on commute convenience and employer concentration. Single adults and younger couples face a starker choice: Campbell’s lower rent and documented walkability reduce car dependence, while Sunnyvale’s higher rent assumes either higher income or a willingness to absorb more transportation and logistics friction.
How this article was built: In addition to public economic data, this article incorporates location-based experiential signals derived from anonymized geographic patterns—such as access density, walkability, and land-use mix—to reflect how day-to-day living actually feels in Campbell, CA.
| Housing Type | Campbell | Sunnyvale | Who Feels the Difference |
|---|---|---|---|
| Median Rent | $2,619/month | $2,990/month | Single adults, early-career couples, households with irregular income |
| Median Home Value | $1,473,700 | $1,680,700 | First-time buyers, families prioritizing space over commute, households saving for down payment |
| Entry Threshold | Lower barrier, more accessible for moderate dual incomes | Higher barrier, assumes established income or dual high earners | All buyers and renters, especially those stretching budgets |
Housing takeaway: Campbell’s lower entry point benefits households where housing cost dominates the budget and where reducing transportation or daily logistics friction matters. Sunnyvale’s higher threshold fits households with established high incomes who prioritize minimal commute time and can absorb higher fixed costs without sacrificing flexibility elsewhere. The difference isn’t just magnitude—it’s about whether the household has income margin to spare or whether every category needs to stay predictable.
Utilities and Energy Costs: Identical Rates, Different Exposure
Both Campbell and Sunnyvale share the same utility infrastructure, with electricity rates at 33.60¢/kWh and natural gas priced at $21.94/MCF. The rates are identical because both cities draw from the same regional grid and gas supply. What differs is how housing stock, building age, and household size translate those rates into actual monthly exposure. Older single-family homes with less efficient insulation, larger square footage, and aging HVAC systems will experience higher usage regardless of city. Newer apartments or townhomes with shared walls and modern construction reduce heating and cooling loads, making the same rate feel less volatile month-to-month.
Silicon Valley’s mild climate keeps extreme heating and cooling costs in check compared to regions with harsh winters or desert summers. Most households face moderate year-round usage rather than sharp seasonal spikes. That said, larger homes—more common in suburban single-family neighborhoods—still see higher baseline consumption simply due to square footage. Families in three- or four-bedroom homes will experience higher utility costs than couples in two-bedroom apartments, even at identical rates. The predictability of utility costs in both cities depends more on housing type and building efficiency than on rate structure or climate extremes.
Households in older housing stock face more volatility, especially if they lack control over insulation upgrades, window efficiency, or HVAC replacement. Renters in older buildings may have less ability to reduce usage through efficiency improvements, meaning their exposure is tied to the landlord’s investment in building systems. Homeowners in aging properties can invest in efficiency upgrades—new windows, insulation, programmable thermostats—but those improvements require upfront capital and time to pay off. Sunnyvale’s higher income baseline suggests more households may have the financial flexibility to make those investments, but Campbell’s lower housing entry cost may leave more budget margin for efficiency upgrades if the home requires them.
Utility takeaway: Utility costs behave identically across Campbell and Sunnyvale due to shared infrastructure, but exposure varies by housing type, building age, and household size. Families in larger, older homes face more volatility and higher baseline usage. Renters in older buildings have less control over efficiency, while homeowners can invest in upgrades if they have the capital. The difference between cities isn’t the rate—it’s whether the household has the income margin and control to reduce exposure over time.
Groceries and Daily Expenses: Access, Habits, and Price Sensitivity
Campbell shows high food and grocery establishment density, meaning households have access to a range of options—discount grocers, mid-tier chains, specialty stores, and prepared food outlets—within a compact area. That density reduces the friction of comparison shopping and gives price-sensitive households more control over where they spend. Families managing larger grocery volumes can choose between bulk discount stores and neighborhood markets depending on the week’s budget. Single adults and couples can shift between cooking at home and grabbing prepared meals without requiring a dedicated trip, which reduces the hidden time cost of meal planning.
Sunnyvale lacks the same visibility into food establishment density and errands accessibility, making it harder to assess whether grocery shopping requires more driving, more planning, or more reliance on convenience options that creep into the budget. In cities where grocery access is more spread out or concentrated along commercial corridors, households end up making more frequent trips to multiple stores or defaulting to higher-priced convenience options near home or work. That pattern doesn’t show up as a single line item—it’s the cumulative effect of grabbing coffee, picking up a few items at a corner store, or ordering takeout because the grocery run requires a 20-minute drive.
Price sensitivity matters more for households where grocery spending is a meaningful share of the budget—families with kids, single adults on moderate incomes, or couples managing student loans or childcare costs. Campbell’s broad accessibility means those households can adjust spending week-to-week without sacrificing time or convenience. If Sunnyvale’s grocery access is more car-dependent or corridor-clustered, the time cost of shopping adds friction that pushes households toward convenience spending even when they’d prefer to cook. The difference isn’t just about prices—it’s about whether the household can execute a low-cost grocery strategy without adding logistical burden.
Groceries takeaway: Campbell’s high food and grocery density gives households more control over price sensitivity and reduces the friction of comparison shopping. Families and budget-conscious singles benefit from accessible options that don’t require extra driving or time. Sunnyvale’s grocery accessibility is less clear, meaning households may face more reliance on convenience spending or longer trips to access discount options. The cost difference shows up not in prices but in whether the household can execute their preferred shopping strategy without added time or friction.
Taxes and Fees: Predictable Structure, Variable Exposure
Both Campbell and Sunnyvale operate under California’s statewide tax structure, meaning sales taxes, state income taxes, and vehicle registration fees behave identically. Property taxes follow Proposition 13 rules, capping annual increases at 2% for existing owners and resetting to 1% of purchase price for new buyers. That structure makes property taxes predictable for long-term residents but front-loads the burden for recent buyers. A household buying in Sunnyvale at $1,680,700 faces a higher initial property tax base than one buying in Campbell at $1,473,700, and that gap persists as long as both households remain in their homes.
Local fees—trash collection, water, sewer, stormwater—vary by city and service provider but typically remain stable year-to-year. Some neighborhoods in both cities may have HOA fees that bundle landscaping, shared amenities, or exterior maintenance, which adds a predictable monthly cost but reduces variability in upkeep expenses. Renters don’t pay property taxes directly, but landlords pass those costs through in rent, meaning the property tax difference between Campbell and Sunnyvale indirectly affects rental pricing over time. New rental buildings reset to current market property tax rates, while older buildings with long-term ownership may carry lower tax bases that allow for more stable rent growth.
Homeowners planning to stay several years benefit from Proposition 13’s predictability, but recent buyers in Sunnyvale absorb a higher ongoing property tax obligation due to the higher purchase price. Renters face less direct exposure to property taxes but more exposure to rent increases driven by turnover and new construction. Households moving frequently or planning short-term stays don’t benefit from the long-term property tax cap, meaning they’re more exposed to the initial cost difference between cities. Fees and taxes don’t vary dramatically between Campbell and Sunnyvale, but the higher housing entry cost in Sunnyvale translates into higher ongoing property tax obligations for new buyers.
Taxes and fees takeaway: Property taxes follow the same statewide structure in both cities, but Sunnyvale’s higher home values mean new buyers face higher ongoing property tax obligations. Long-term homeowners benefit from predictable growth, while recent buyers and renters are more exposed to the initial cost difference. Local fees remain stable and predictable in both cities, with HOAs adding fixed costs in some neighborhoods. The primary difference is magnitude, not structure, and it affects new buyers and recent movers most.
Transportation & Commute Reality
Campbell’s average commute is 25 minutes, while Sunnyvale’s is 23 minutes—a small difference in time but one that interacts with how people actually move through each city. Campbell shows substantial pedestrian infrastructure, rail transit presence, and notable bike infrastructure, meaning households can reduce or eliminate car dependence for daily errands, short trips, and some commutes. That infrastructure doesn’t just save on gas—it reduces insurance costs, parking friction, vehicle maintenance, and the time cost of finding parking or sitting in traffic. Sunnyvale’s slightly shorter average commute suggests proximity to major employers, but without clear visibility into transit coverage or walkability, the assumption is that most households rely on cars for both commuting and daily errands.
Gas prices sit at $4.22 per gallon in both cities, but the cost of driving depends on how often the car is necessary. In Campbell, households near rail stations or within walkable pockets can use transit for work commutes and bikes or walking for errands, reserving the car for longer trips or weekend activities. That flexibility reduces the frequency of fill-ups and the cumulative cost of car ownership. In Sunnyvale, if most trips require a car, the same gas price translates into higher monthly fuel costs simply due to more frequent use. The difference isn’t the price per gallon—it’s how many gallons the household burns each month.
Long commute exposure—defined as commutes over a certain threshold—affects 37.7% of Campbell workers and 32.2% of Sunnyvale workers. That gap suggests Sunnyvale residents are slightly less likely to face extended commutes, possibly due to proximity to major tech campuses or regional job centers. But commute time alone doesn’t capture the full transportation picture. A 23-minute car commute in stop-and-go traffic feels different from a 25-minute rail commute where the rider can read, work, or relax. Campbell’s rail access and bike infrastructure give households more options for how they commute, while Sunnyvale’s shorter average commute may still require car ownership if transit and walkability are limited.
Transportation takeaway: Campbell’s documented walkability, rail transit, and bike infrastructure reduce car dependence for daily errands and some commutes, lowering the cumulative cost of transportation even with a slightly longer average commute. Sunnyvale’s shorter average commute benefits households prioritizing minimal drive time, but without the same infrastructure visibility, the assumption is higher car reliance for both commuting and errands. The cost difference isn’t just fuel—it’s whether the household can avoid or reduce car ownership altogether.
Cost Structure Comparison
Housing dominates the cost experience in both Campbell and Sunnyvale, but the entry barrier differs enough to shape which households can access each city and how much flexibility remains after housing is covered. Campbell’s lower rent and home values create more accessible entry for first-time buyers, single adults, and early dual-income couples, while Sunnyvale’s higher threshold assumes established incomes or dual high earners. That difference matters most for households where housing cost determines timeline, savings capacity, or ability to absorb volatility in other categories.
Utilities introduce identical rate exposure across both cities, but the cost experience varies by housing type, building age, and household size. Families in larger, older homes face more volatility regardless of city, while renters in newer apartments benefit from shared walls and modern efficiency. The primary difference isn’t between Campbell and Sunnyvale—it’s between housing stock within each city and whether the household has control over efficiency improvements.
Transportation patterns matter more in Campbell, where walkability, rail access, and bike infrastructure reduce car dependence and lower the cumulative cost of daily mobility. Sunnyvale’s shorter average commute benefits households prioritizing minimal drive time, but without the same infrastructure visibility, the assumption is higher car reliance for errands and commuting. The cost difference shows up not in gas prices but in how often the car is necessary and whether the household can avoid or reduce ownership altogether.
Daily living and groceries introduce more friction in cities where errands accessibility is lower or more spread out. Campbell’s high food and grocery density gives households more control over price sensitivity and reduces the time cost of comparison shopping. Sunnyvale’s grocery accessibility is less clear, meaning households may face more reliance on convenience spending or longer trips to access discount options. The difference isn’t about prices—it’s about whether the household can execute a low-cost strategy without added logistical burden.
For households sensitive to housing entry barriers, Campbell offers more accessible thresholds and documented infrastructure that reduces ongoing transportation and errands friction. For households with established high incomes who prioritize minimal commute time and can absorb higher fixed costs, Sunnyvale’s proximity to major employers and shorter average commute may justify the premium. The decision is less about which city is cheaper and more about which costs dominate the household’s financial and time budget—and whether the place structure reduces or amplifies those pressures.
How the Same Income Feels in Campbell vs Sunnyvale
Single Adult
Housing becomes the first non-negotiable cost, and the difference in rent creates or eliminates flexibility for transportation, dining, and irregular expenses. In Campbell, lower rent pairs with walkability and transit access, meaning the single adult can reduce or avoid car ownership and still access work, errands, and social activities. In Sunnyvale, higher rent assumes higher income, but if the single adult is early-career or managing student loans, the rent burden leaves less room for transportation flexibility or convenience spending. The ability to walk or bike to errands in Campbell reduces the cumulative friction of car ownership, while Sunnyvale’s cost structure assumes the income exists to absorb both higher rent and car dependence without sacrificing other priorities.
Dual-Income Couple
Housing entry becomes more accessible with two incomes, but the difference in rent or mortgage still determines how much margin remains for savings, travel, or discretionary spending. In Campbell, lower housing costs and integrated parks create flexibility for couples planning to start a family or managing dual commutes. In Sunnyvale, higher housing costs assume both incomes are stable and high enough to absorb the premium without sacrificing long-term savings or lifestyle flexibility. The role of commute friction differs: Campbell’s rail and bike infrastructure allows one or both partners to reduce car dependence, while Sunnyvale’s shorter average commute benefits couples where both partners work nearby but still rely on cars for daily logistics.
Family with Kids
Housing, childcare, and transportation become non-negotiable, and the cost structure determines whether the family has margin for irregular expenses, activities, or savings. In Campbell, lower housing entry pairs with strong school density, integrated parks, and walkability, meaning the family can reduce transportation costs and access family infrastructure without added driving. In Sunnyvale, higher housing costs assume higher dual incomes, but without the same visibility into family infrastructure or walkability, the family may face more car dependence for school drop-offs, errands, and activities. The difference isn’t just housing—it’s whether the place structure reduces or amplifies the cumulative logistics burden of managing a household with kids.
Decision Matrix: Which City Fits Which Household?
| Decision Factor | If You’re Sensitive to This… | Campbell Tends to Fit When… | Sunnyvale Tends to Fit When… |
|---|---|---|---|
| Housing entry + space needs | Down payment timeline, monthly rent flexibility, ability to absorb housing cost without sacrificing other categories | You need lower entry barriers and more accessible rent or purchase thresholds | You have established dual high incomes and prioritize proximity to specific employers over entry cost |
| Transportation dependence + commute friction | Car ownership costs, commute predictability, ability to walk or bike for errands | You want to reduce or eliminate car dependence and value rail, bike, and walkable errands access | You prioritize minimal commute time and can absorb car ownership costs without strain |
| Utility variability + home size exposure | Predictability of monthly bills, ability to control usage through efficiency upgrades | You have margin to invest in efficiency upgrades or choose newer, smaller housing stock | You have income flexibility to absorb higher baseline usage in larger or older homes |
| Grocery strategy + convenience spending creep | Time cost of shopping, ability to comparison shop, reliance on prepared foods | You want accessible grocery options that reduce driving and support price-sensitive shopping | You have income margin to absorb convenience spending or longer trips to discount stores |
| Fees + friction costs (HOA, services, upkeep) | Predictability of recurring fees, ability to absorb property tax resets on new purchases | You’re buying at a lower property tax base and want predictable long-term ownership costs | You can absorb higher initial property tax obligations due to higher purchase price |
| Time budget (schedule flexibility, errands, logistics) | Cumulative burden of managing household logistics, school drop-offs, errands | You value walkable errands, integrated parks, and reduced driving for daily tasks | You prioritize minimal commute time and have flexibility to absorb car-dependent logistics |
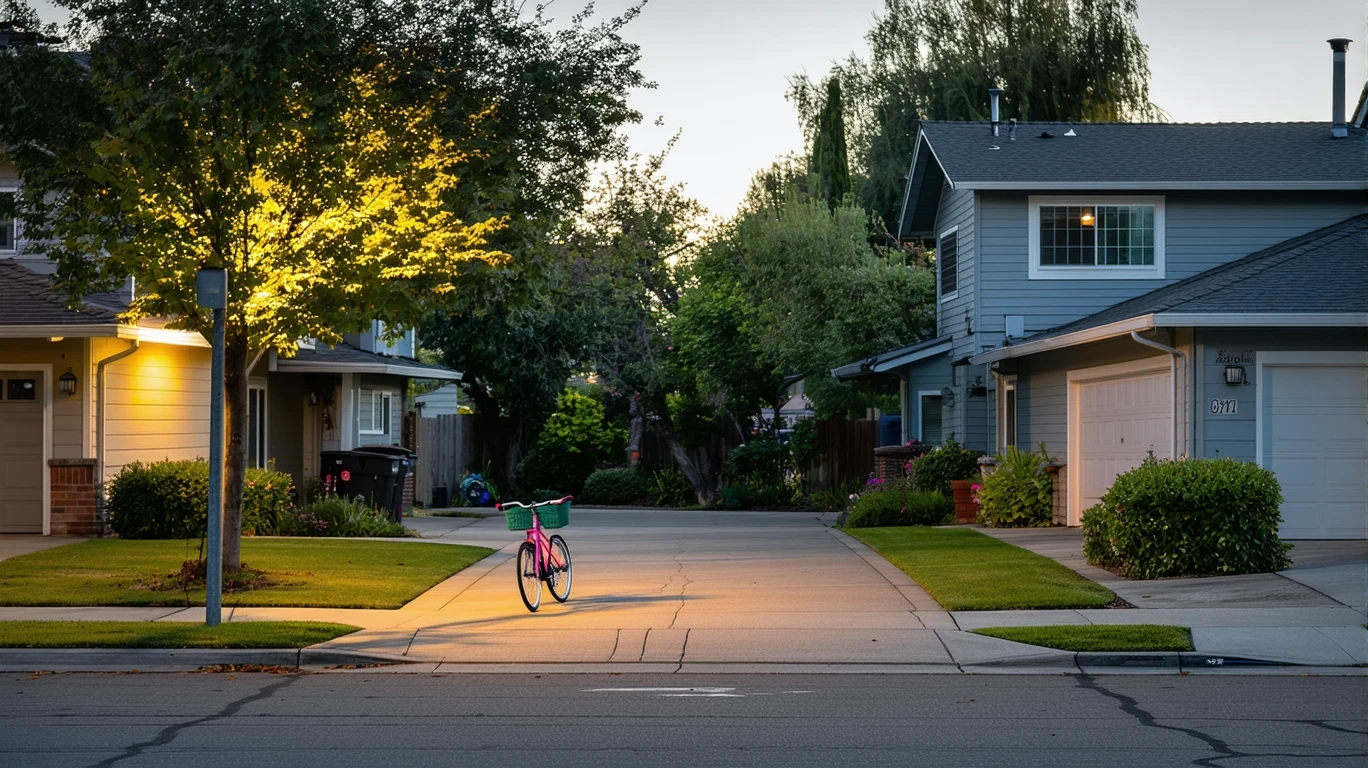
Lifestyle Fit: How Place Structure Shapes Daily Life
Campbell’s documented walkable pockets, rail transit access, and notable bike infrastructure create a different daily rhythm than what most Silicon Valley suburbs offer. Households near rail stations can commute without cars, and the high density of food and grocery establishments means errands don’t require dedicated driving trips. Integrated parks and strong family infrastructure—high school density and moderate playground access—make Campbell particularly functional for families managing school drop-offs, after-school activities, and weekend outings without constant car dependence. The mixed building height and land-use mix suggest a more urban-suburban hybrid texture, where residential streets sit near commercial corridors and daily needs stay within a compact area.
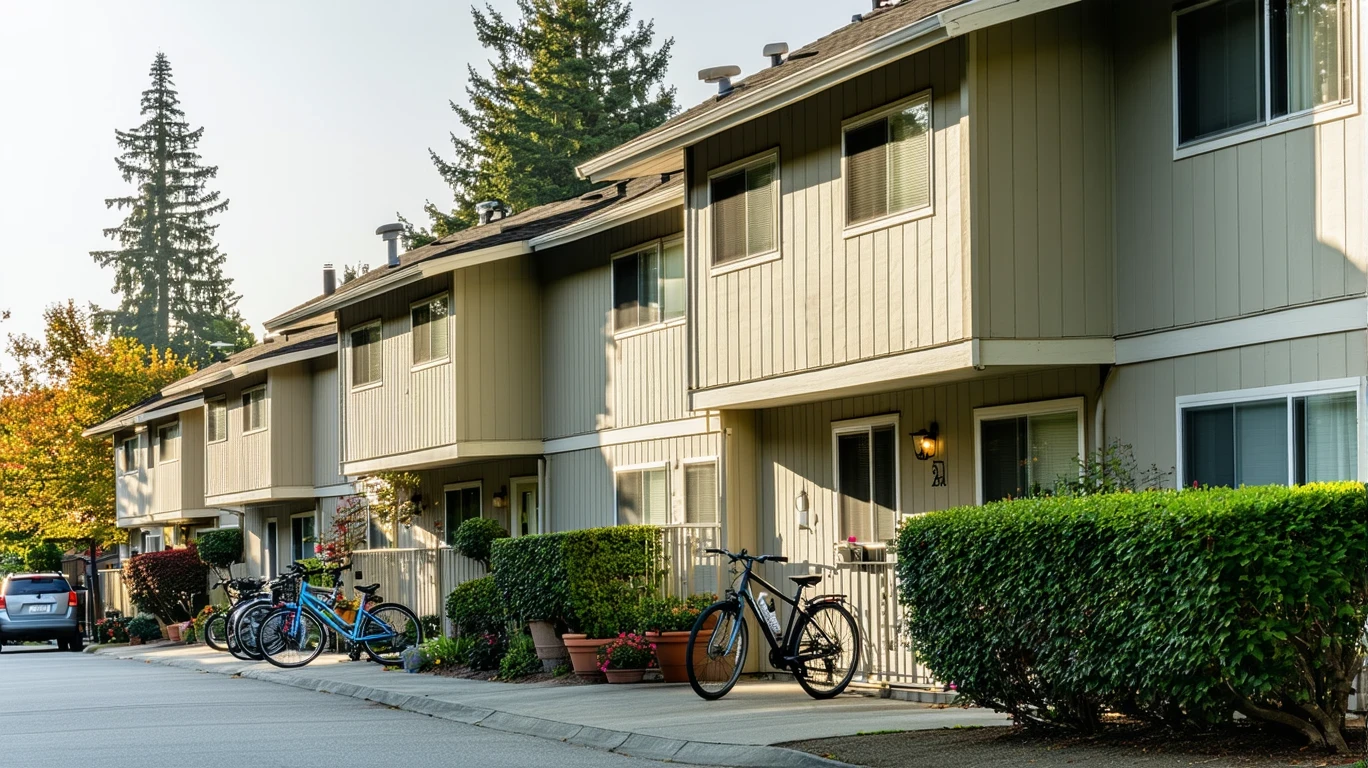
Sunnyvale’s lifestyle profile is less visible without the same infrastructure data, but the shorter average commute and higher income baseline suggest proximity to major tech employers and a resident base oriented toward minimizing drive time. The city’s role as a regional employment hub means many residents work locally, reducing the need for long commutes but not necessarily reducing car dependence for errands, groceries, or family logistics. Without clear visibility into walkability or transit coverage, the assumption is that most households rely on cars for daily mobility, even if the commute itself is short.
Both cities benefit from Silicon Valley’s mild climate, access to regional parks, and proximity to cultural and recreational amenities in the broader Bay Area. Campbell’s integrated parks and water features provide local green space access without requiring weekend drives, while Sunnyvale’s residents may rely more on regional parks or private recreational facilities. The lifestyle difference isn’t about amenities in isolation—it’s about whether the household can access daily needs, work, and recreation without constant car dependence and whether the place structure reduces or amplifies the cumulative logistics burden of managing a household.
Campbell median household income: $141,794/year | Sunnyvale median household income: $174,506/year
Campbell commute: 25 minutes average | Sunnyvale commute: 23 minutes average
Frequently Asked Questions
Is Campbell or Sunnyvale cheaper for renters in 2026?
Campbell’s median gross rent is $2,619 per month compared to Sunnyvale’s $2,990, making Campbell more accessible for single adults, early-career couples, and households managing moderate dual incomes. The difference isn’t just the monthly payment—it’s how much flexibility remains after rent is covered. Campbell’s lower rent pairs with documented walkability and transit access, meaning renters can reduce or eliminate car ownership and still access work, errands, and daily needs. Sunnyvale’s higher rent assumes higher income and likely requires car ownership for most daily logistics, meaning the cumulative cost of renting includes both housing and transportation dependence.
Which city is better for families comparing Campbell and Sunnyvale in 2026?
Campbell shows strong family infrastructure with high school density, moderate playground access, and integrated parks, all at a lower housing entry cost. Families benefit from walkable errands, rail transit for parents commuting, and accessible green space without requiring constant driving. Sunnyvale’s higher housing cost and shorter average commute may appeal to families where both parents work nearby and can absorb the premium, but without the same visibility into family amenities or walkability, the cost structure assumes higher income and more car dependence for school drop-offs, activities, and errands. Campbell fits families where budget planning requires balancing housing, transportation, and logistics friction, while Sunnyvale fits families with established dual high incomes prioritizing minimal commute time.
How do transportation costs differ between Campbell and Sunnyvale in 2026?
Gas prices are identical at $4.22 per gallon, but transportation costs depend on how often the car is necessary. Campbell’s walkable pockets, rail transit, and notable bike infrastructure allow households to reduce or eliminate car dependence for errands, short trips, and some commutes, lowering the cumulative cost of fuel, insurance, maintenance, and parking. Sunnyvale’s shorter average commute benefits households prioritizing minimal drive time, but without the same infrastructure visibility, the assumption is higher car reliance for both commuting and daily errands. The cost difference isn’t the price per gallon—it’s how many gallons the household burns each month and whether car ownership is negotiable.
Do utilities cost more in Campbell or Sunnyvale in 2026?
Utility rates are identical across both cities—33.60¢/kWh for electricity and $21.94/MCF for natural gas—because they share the same regional infrastructure. The cost experience differs based on housing type, building age, and household size, not location. Families in larger, older single-family homes face higher usage and more volatility regardless of city, while couples in newer apartments benefit from shared walls and modern efficiency. The difference between Campbell and Sunnyvale isn’t the rate—it’s whether the household has control over efficiency improvements and whether the housing stock amplifies or reduces baseline usage.
Which city has lower overall cost of living, Campbell or Sunnyvale, in 2026?
The question assumes a universal answer, but the right city depends entirely on which costs dominate your household. Campbell offers lower housing entry, documented walkability and transit access that reduce transportation costs, and strong family infrastructure at a more accessible price point. Sunnyvale requires higher income but offers a shorter average commute and proximity to major employers. For households where housing entry barriers and transportation dependence matter most, Campbell provides more accessible thresholds and infrastructure that reduces ongoing friction. For households with established high incomes prioritizing minimal commute time, Sunnyvale’s premium may be justified. The decision isn’t about which city is cheaper—it’s about whether your household is more exposed to housing entry costs, ongoing transportation friction, or the cumulative logistics burden of daily life.
Conclusion
Campbell and Sunnyvale both demand high incomes by national standards, but the cost experience in each city diverges based on where pressure concentrates and how place structure amplifies or reduces daily friction. Campbell’s lower housing entry, documented walkability, rail transit, and strong family infrastructure create more accessible thresholds for first-time buyers, single adults, and families managing moderate dual incomes. The city’s place structure reduces transportation dependence and errands friction, meaning households can absorb lower incomes without sacrificing access to work, daily needs, or family amenities. Sunnyvale’s higher housing costs and shorter average commute fit