
Edmonds and Seattle sit just 15 miles apart in the same metro area, share the same regional price environment, and draw from overlapping job markets—yet the cost structure of daily life in each city diverges in ways that matter deeply for household decision-making in 2026. This isn’t a story about one city being universally cheaper or more expensive. It’s about where financial pressure concentrates, how predictably costs behave, and which households feel those differences most acutely. Families weighing space against convenience, commuters calculating time versus transportation expenses, and renters comparing entry barriers all face distinct tradeoffs depending on which city they choose.
The decision between Edmonds and Seattle hinges less on total affordability and more on which costs dominate your household’s budget and daily logistics. Housing entry costs, commute patterns, grocery accessibility, healthcare proximity, and the friction of running errands all shift depending on where you live—and those shifts don’t affect every household the same way. Understanding how these structural differences play out in 2026 means looking beyond sticker prices to examine how each city’s infrastructure, density, and layout shape the rhythm and expense of everyday life.
Housing Costs
Housing represents the most visible cost difference between Edmonds and Seattle, but the distinction isn’t just about price—it’s about what kind of housing pressure each city imposes. Seattle’s median home value of $879,900 and median gross rent of $1,945 per month reflect the density, verticality, and urban accessibility that define the city’s housing market. Edmonds, with a median home value of $761,300 and median gross rent of $1,821 per month, offers a lower entry threshold but still represents substantial financial commitment. Both cities operate within the elevated housing cost environment typical of the Seattle metro, meaning affordability challenges exist in both places—just in different forms.
For renters, the difference between $1,821 and $1,945 per month translates to distinct exposure depending on household size and income stability. Seattle’s rental market skews toward apartments and higher-density buildings, which often include more predictable utility structures and proximity to transit. Edmonds leans toward single-family rentals and lower-rise buildings, which may offer more space but introduce greater variability in heating costs, yard maintenance expectations, and commute dependence. Renters prioritizing walkability and errands convenience may find Seattle’s density reduces non-housing friction, while those seeking quieter residential character and outdoor space may accept Edmonds’ slightly lower rent in exchange for a different lifestyle structure.
Homebuyers face a more complex calculation. The $118,600 difference in median home values represents a meaningful gap in down payment requirements, mortgage qualification thresholds, and ongoing property tax obligations. Seattle’s housing stock includes more condos and townhomes, which can lower entry costs within the city but introduce HOA fees and shared-wall living. Edmonds offers more detached single-family homes, which appeal to families prioritizing space and privacy but come with full responsibility for maintenance, utilities, and upkeep. First-time buyers stretching to afford either market must weigh whether Seattle’s urban infrastructure offsets higher entry costs through reduced transportation needs, or whether Edmonds’ lower entry barrier and residential character justify accepting longer commutes and car dependence.
Housing takeaway: Households prioritizing lower entry costs and single-family residential character face less initial financial pressure in Edmonds, while those valuing density, walkability, and reduced car dependence may find Seattle’s higher housing costs offset by infrastructure advantages. The decision depends on whether your household is more exposed to upfront barriers or ongoing transportation and logistics friction.
Utilities and Energy Costs
Utility cost behavior in Edmonds and Seattle reflects subtle but meaningful differences in energy pricing and housing stock, even though both cities share the same regional climate and similar electricity rates. Edmonds’ electricity rate of 13.85¢/kWh and Seattle’s 14.06¢/kWh sit close enough that seasonal electric usage—driven primarily by heating, cooling, and baseline household needs—produces comparable exposure for similar-sized homes. The more significant divergence appears in natural gas pricing: Edmonds’ $16.72/MCF versus Seattle’s $24.71/MCF creates a structural difference in heating-season costs for households relying on gas furnaces, water heaters, or dryers.
This natural gas gap matters most for single-family homeowners in older housing stock, where gas heating dominates and insulation quality varies. Families in Edmonds with gas heat face lower per-unit costs during winter months, which can translate to more predictable heating bills when usage spikes. Seattle households in similar housing face higher per-unit gas costs, though many newer apartments and condos in the city use electric heat or centralized systems that distribute costs differently. Renters in Seattle’s higher-density buildings may see utilities bundled or averaged across units, reducing individual volatility but also limiting control over usage-based savings.
Housing type amplifies these differences. Single-family homes in Edmonds—often larger, detached, and older—expose households to greater total energy usage even when per-unit costs are lower. Seattle’s more vertical housing stock, with smaller average unit sizes and shared walls, reduces baseline heating and cooling needs regardless of rate differences. Families managing larger homes in Edmonds gain from lower gas rates but face higher absolute usage; couples or single adults in Seattle apartments benefit from reduced square footage and shared-wall insulation, even when per-unit rates are higher. The tradeoff isn’t just about price—it’s about whether your household’s energy exposure comes from unit costs or total consumption driven by home size and layout.
Utility takeaway: Households in larger, gas-heated single-family homes experience lower per-unit heating costs in Edmonds, while those in smaller, higher-density housing in Seattle face higher gas rates but reduced total consumption. Predictability favors Edmonds for detached homeowners; efficiency and lower baseline usage favor Seattle for apartment and condo dwellers.
Groceries and Daily Expenses
Grocery and daily spending pressure in Edmonds and Seattle reflects less about price differences—both cities share the same regional price parity index of 113—and more about how accessibility, density, and shopping infrastructure shape household behavior. Seattle’s broadly accessible food and grocery landscape, with high-density options distributed throughout the city, gives households more flexibility to comparison-shop, walk to stores, and integrate errands into daily routines without dedicated car trips. Edmonds’ corridor-clustered grocery access concentrates options along specific commercial strips, requiring more intentional planning and often car-based trips to reach competitive pricing or specialty items.
This structural difference affects households unevenly. Single adults and couples in Seattle benefit from the ability to grab groceries on foot or by bike between work and home, reducing both transportation costs and the time friction of dedicated shopping trips. Families managing larger weekly grocery volumes may find Seattle’s density offers more frequent small-shop options but less parking convenience for bulk purchases. In Edmonds, families with cars can access big-box stores and discount grocers along commercial corridors, but the trip requires more planning and fuel. Households without reliable car access in Edmonds face meaningfully higher friction reaching grocery options compared to Seattle, where transit and walkability reduce dependence on personal vehicles for daily errands.
Dining out and convenience spending follow similar patterns. Seattle’s higher concentration of restaurants, coffee shops, and prepared food options creates more opportunities for convenience spending—both positive (time savings, variety) and negative (spending creep when grabbing takeout becomes the default). Edmonds offers fewer walk-up dining options, which can reduce impulse spending but also increases the effort required to access variety. Families prioritizing home cooking and bulk grocery strategies may find Edmonds’ lower dining density helps contain convenience spending, while busy professionals in Seattle may value the time savings of accessible prepared food even when it increases monthly food costs.
Grocery takeaway: Households prioritizing walkable errands, frequent small shops, and reduced car dependence benefit from Seattle’s broadly accessible grocery infrastructure. Households comfortable with car-based shopping, bulk purchasing, and lower dining density may find Edmonds reduces convenience spending creep while still offering competitive grocery pricing along commercial corridors.
Taxes and Fees
Tax and fee structures in Edmonds and Seattle operate within Washington State’s framework—no state income tax, reliance on sales and property taxes, and local fees for services—but the way these costs show up in household budgets differs based on housing type, consumption patterns, and length of residence. Property taxes in both cities reflect elevated home values typical of the Seattle metro, meaning homeowners face substantial annual obligations regardless of location. The higher median home value in Seattle translates to higher absolute property tax bills for comparable housing, though effective rates and local levies vary by neighborhood and school district.
Renters don’t pay property taxes directly, but those costs are embedded in rent and influence landlord pricing decisions. Seattle’s higher density and prevalence of professionally managed apartment buildings often means more predictable fee structures—trash, water, and sewer may be bundled into rent or charged as flat monthly fees. Edmonds’ single-family rental market more commonly passes utility and service costs directly to tenants, creating greater variability depending on usage and home size. Renters prioritizing predictability may find Seattle’s bundled fee structures easier to budget, while those willing to manage variable costs may prefer Edmonds’ lower base rent even when utilities and services are billed separately.
HOA fees represent another structural difference. Seattle’s condo and townhome market frequently includes HOA fees ranging from modest (covering exterior maintenance and insurance) to substantial (including amenities, reserves, and shared utilities). These fees add ongoing monthly obligations but can also reduce unpredictability by covering major repairs and exterior upkeep. Edmonds’ detached single-family homes typically avoid HOA fees entirely, giving homeowners full control over maintenance timing and spending but also full exposure to unexpected repair costs. Long-term homeowners in Edmonds gain flexibility and avoid rising HOA assessments; those in Seattle condos trade higher monthly fees for reduced maintenance volatility and shared responsibility.
Tax and fee takeaway: Homeowners in Seattle face higher absolute property taxes and more frequent HOA fees, which increase ongoing obligations but can improve cost predictability. Homeowners in Edmonds avoid HOA fees and face slightly lower property tax totals but assume full responsibility for maintenance volatility. Renters in Seattle benefit from more bundled, predictable fee structures, while Edmonds renters face greater variability in utility and service costs.
Transportation & Commute Reality
Transportation costs and commute friction diverge meaningfully between Edmonds and Seattle, driven not by dramatic differences in distance or time but by how infrastructure, density, and car dependence shape daily logistics. Edmonds shows an average commute time of 28 minutes, with 47.9% of workers experiencing long commutes and only 11.0% working from home. Seattle’s 27-minute average commute, 43.2% long-commute share, and 6.3% work-from-home rate suggest slightly shorter trips on average, but the more significant difference lies in how people move and what alternatives exist beyond driving.
Seattle’s notable bike infrastructure and broadly accessible transit options—including rail service—give households more flexibility to reduce or eliminate car dependence for commuting and errands. Edmonds also offers rail connectivity and walkable pockets, but bike infrastructure remains limited to some areas, and the corridor-clustered layout of grocery and services means most households still rely on cars for daily logistics. Gas prices reinforce this pattern: Edmonds’ $4.15/gallon versus Seattle’s $3.80/gallon creates a per-fill cost difference that compounds for households driving frequently. Commuters in Edmonds who work outside the city face both higher fuel costs and fewer viable alternatives to driving, while Seattle residents benefit from lower gas prices and stronger infrastructure for biking, transit, or walking to work.
The transportation tradeoff extends beyond commuting. Families in Edmonds managing school drop-offs, grocery runs, and weekend activities typically plan around car-based logistics, which increases fuel spending and time spent driving but offers flexibility and control. Families in Seattle with access to transit and bike lanes can reduce car trips for errands and activities, lowering fuel costs and parking friction but requiring more coordination around transit schedules and weather. Single adults and couples in Seattle gain the most from reduced car dependence—biking to work, walking to groceries, and using transit for evening plans becomes feasible in ways that remain difficult in Edmonds without a personal vehicle.
Transportation takeaway: Households prioritizing reduced car dependence, lower fuel costs, and stronger bike/transit infrastructure benefit from Seattle’s accessibility and lower gas prices. Households comfortable with car-based logistics and prioritizing residential character over transit proximity face higher fuel costs and longer commute exposure in Edmonds but gain flexibility and control over daily movement.
Cost Structure Comparison
Housing pressure dominates the cost experience in both Edmonds and Seattle, but the form that pressure takes differs in ways that matter for household decision-making. Seattle imposes higher entry barriers—both for renters and buyers—but offsets those costs with infrastructure that reduces transportation dependence, increases errands accessibility, and concentrates services within walkable or bikeable distance. Edmonds offers lower housing entry costs and more single-family residential character, but households trade that advantage for higher fuel costs, greater car dependence, and more friction accessing groceries, healthcare, and daily services without a vehicle.
Utilities introduce more variability in Edmonds for households in larger, gas-heated single-family homes, where natural gas savings during heating season provide some relief but total consumption remains higher due to home size. Seattle’s more vertical housing stock and higher-density buildings reduce baseline energy usage even when per-unit gas rates are higher, meaning smaller households and apartment dwellers experience more predictable utility costs. Families managing larger homes in Edmonds benefit from lower per-unit heating costs but face greater total exposure; couples and single adults in Seattle apartments gain from reduced square footage and shared-wall efficiency.
Transportation patterns matter more in Edmonds, where car dependence is structural rather than optional. The combination of higher gas prices, longer commutes, and limited bike infrastructure means households without reliable car access face meaningful barriers to employment and errands. Seattle’s stronger transit and bike networks, combined with lower gas prices and shorter average commutes, reduce the financial and time cost of daily movement—but only for households positioned to use those alternatives. Families with school-age children or multiple activity schedules may still rely on cars in Seattle, diminishing the transportation advantage.
Grocery and daily errands accessibility shapes household logistics friction more than absolute spending. Seattle’s broadly accessible food and service options reduce the time and planning burden of running errands, which translates to less car usage and more flexibility for households managing tight schedules. Edmonds’ corridor-clustered grocery access requires more intentional trip planning and car-based logistics, which increases friction but can also reduce convenience spending creep by making impulse purchases less accessible.
For households sensitive to upfront housing costs and seeking single-family residential character, Edmonds offers lower entry barriers and more space per dollar. For households sensitive to transportation friction, errands accessibility, and healthcare proximity, Seattle’s higher housing costs are offset by infrastructure that reduces car dependence and daily logistics complexity. The decision is less about which city costs more overall and more about which cost structure aligns with how your household earns, moves, and manages daily life.
How the Same Income Feels in Edmonds vs Seattle
Single Adult
For a single adult, housing becomes the non-negotiable anchor in both cities, but Seattle’s density and transit options create more flexibility in how the rest of the budget unfolds. In Edmonds, car ownership and fuel costs become unavoidable for commuting and errands, compressing discretionary spending even when base rent is slightly lower. Seattle allows some single adults to eliminate or reduce car dependence entirely, redirecting transportation savings toward housing or lifestyle, though the higher rent absorbs much of that gain. The difference is less about total cost and more about whether your income supports car-based logistics or benefits from walkable infrastructure.
Dual-Income Couple
A dual-income couple in Edmonds faces lower housing entry costs but higher exposure to commute friction and fuel expenses if both partners work outside the city, making transportation a secondary but persistent cost driver. In Seattle, the couple pays more for housing but gains shorter commutes, better transit access, and the ability to share one car or go car-free if both work centrally. Flexibility emerges differently: Edmonds couples gain more space and quieter surroundings but less time; Seattle couples gain time and reduced logistics friction but less space. The same gross income feels more stretched in Edmonds when both partners commute, and more flexible in Seattle when transit and density reduce daily coordination costs.
Family with Kids
Families with children face the starkest tradeoff between housing space and infrastructure access. In Edmonds, lower home prices and larger yards become non-negotiable for families prioritizing space, but car dependence intensifies with school drop-offs, activity shuttles, and grocery runs—all requiring fuel, time, and coordination. In Seattle, higher housing costs compress space options, but stronger school and playground density, hospital access, and broadly accessible errands reduce the logistics burden of managing a household. The same income in Edmonds buys more physical space but requires more driving and planning; in Seattle, it buys less space but reduces the friction of daily family logistics through proximity and infrastructure.
Decision Matrix: Which City Fits Which Household?
| Decision factor | If you’re sensitive to this… | Edmonds tends to fit when… | Seattle tends to fit when… | |
|---|---|---|---|---|
| Housing entry + space needs | You prioritize lower upfront costs and single-family residential character over density and walkability. | You value detached homes, larger yards, and quieter neighborhoods even if it means accepting car dependence. | You prioritize proximity to work, transit, and services over square footage and are comfortable with higher-density housing. | |
| Transportation dependence + commute friction | You want to minimize fuel costs, commute time, or car ownership requirements in daily life. | You already own a car, work locally or remotely, and prefer driving-based flexibility over transit schedules. | You work centrally, value bike and transit infrastructure, and want to reduce or eliminate car dependence for commuting and errands. | |
| Utility variability + home size exposure | You want predictable energy costs or are managing a larger home with gas heating during winter months. | You own or rent a single-family home with gas heat and benefit from lower per-unit heating costs despite higher total usage. | You live in an apartment or condo where smaller square footage and shared walls reduce baseline energy consumption despite higher gas rates. | |
| Grocery strategy + convenience spending creep | You want walkable access to groceries and dining or prefer to limit impulse convenience spending through reduced accessibility. | You plan bulk grocery trips by car, cook at home frequently, and value lower dining density to contain convenience spending. | You prioritize walkable errands, frequent small shops, and accessible dining options even if it increases convenience spending opportunities. | |
| Fees + friction costs (HOA, services, upkeep) | You want to avoid ongoing HOA fees and prefer full control over maintenance timing and spending. | You accept full responsibility for home maintenance and repairs in exchange for avoiding monthly HOA obligations and shared decision-making. | You value predictable monthly fees that cover exterior maintenance, reserves, and shared amenities even if they increase ongoing costs. | |
| Time budget (schedule flexibility, errands, logistics) | You want to minimize the time and coordination burden of running errands, managing healthcare, and handling daily household logistics. | You have flexible schedules, work from home, or prioritize residential quiet over proximity to services and are comfortable planning car-based errands. | You manage tight schedules, value proximity to schools and healthcare, and benefit from infrastructure that reduces daily logistics friction. |
Lifestyle Fit
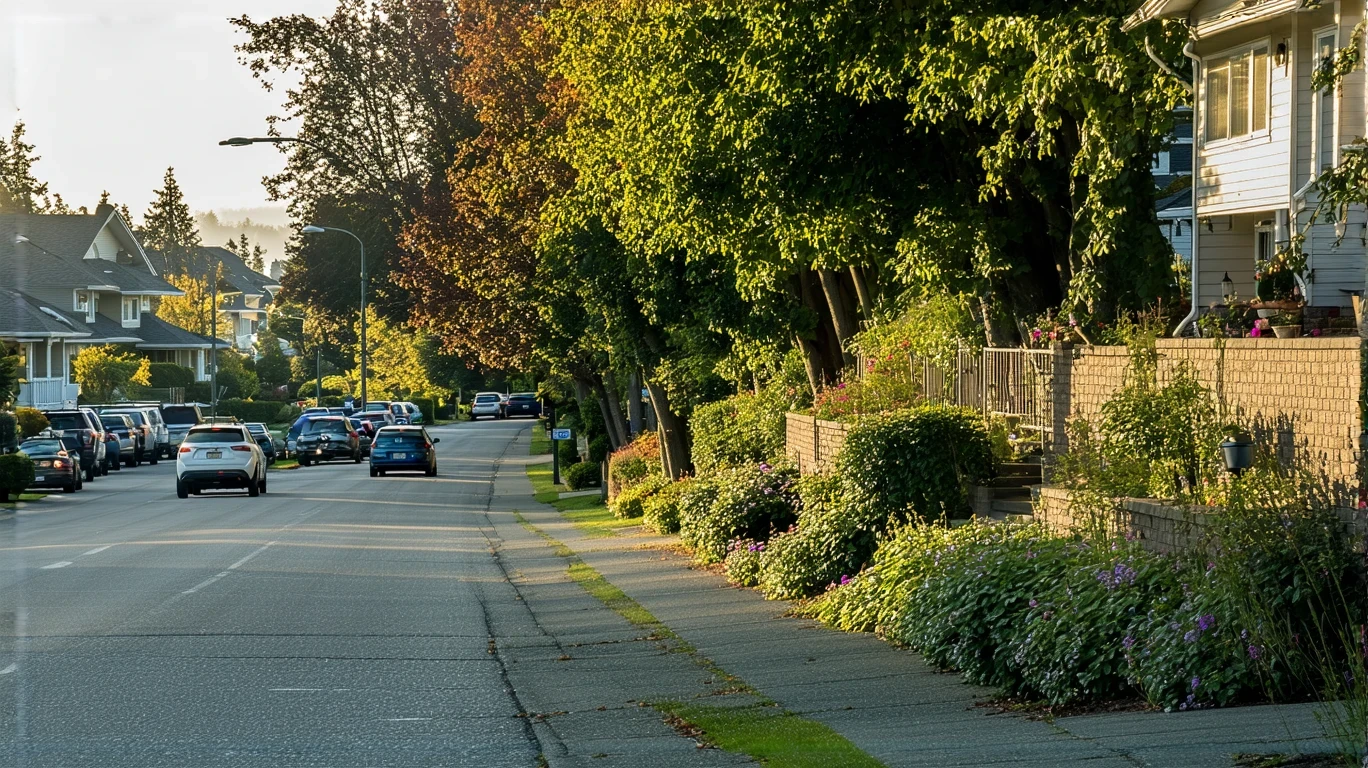
Lifestyle differences between Edmonds and Seattle extend beyond cost into how daily life unfolds, shaped by density, infrastructure, and the rhythm of each city’s layout. Seattle’s more vertical urban form, hospital presence, and broadly accessible errands create an environment where households can manage work, healthcare, and daily tasks within a compact geography. Families benefit from stronger school and playground density, reducing the distance and time required to access educational and recreational infrastructure. The city’s notable bike infrastructure and integrated green space—including waterfront access—support active lifestyles without requiring a car for every outing. Seattle’s college-city character also brings cultural amenities, dining variety, and evening entertainment options that appeal to younger professionals and families seeking urban engagement.
Edmonds offers a quieter, more residential lifestyle centered on single-family neighborhoods, integrated parks, and waterfront access. The city’s walkable pockets and rail connectivity provide some urban convenience, but the overall texture leans toward car-based logistics and planned outings rather than spontaneous errands. Families gain more outdoor space—both private yards and public parks—and a slower pace that appeals to those prioritizing residential calm over urban energy. The corridor-clustered layout of services means fewer walk-up options for dining or shopping, which reduces convenience spending opportunities but also requires more intentional planning for daily tasks. Edmonds suits households comfortable with driving as the primary mode of movement and valuing green space and residential character over density and accessibility.
Commute times in both cities hover around the same range—27 to 28 minutes on average—but the experience differs based on mode and infrastructure. Seattle commuters benefit from stronger transit and bike options, making car-free commuting viable for some households and reducing parking costs and fuel exposure. Edmonds commuters face higher gas prices and fewer alternatives to driving, meaning the commute cost includes both time and fuel. For families, Seattle’s stronger family infrastructure and hospital access reduce the friction of managing children’s healthcare, schooling, and activities, while Edmonds’ integrated green space and lower housing density offer more room for outdoor play and family gatherings at home.
Seattle’s unemployment rate of 4.1% and Edmonds’ 4.2% reflect similar labor market conditions across the metro. Both cities share a regional price parity index of 113, meaning grocery and goods pricing operates within the same elevated cost environment typical of the Seattle metro.
Frequently Asked Questions
Is Edmonds or Seattle more affordable for renters in 2026?
Edmonds offers slightly lower median rent, but the affordability question depends on whether your household benefits more from reduced housing costs or reduced transportation and errands friction. Renters in Edmonds face lower base rent but higher car dependence and fuel costs, while Seattle renters pay more for housing but gain access to transit, bike infrastructure, and walkable errands that can reduce transportation spending and time costs. Single adults and couples who can eliminate or reduce car ownership in Seattle may find the higher rent offset by transportation savings, while families prioritizing space and residential character may prefer Edmonds’ lower rent despite car-based logistics.
How do commute costs compare between Edmonds and Seattle in 2026?
Commute costs in Edmonds are shaped by higher gas prices and greater car dependence, with fewer viable alternatives to driving for work or errands. Seattle’s lower gas prices, stronger transit network, and notable bike infrastructure reduce fuel exposure and create more options for car-free or car-light commuting. Households in Edmonds with long commutes face both higher per-gallon fuel costs and limited transit alternatives, while Seattle commuters benefit from shorter average commute times and more flexibility in how they travel. The cost difference isn’t just fuel—it’s the time and logistics friction of managing a car-dependent commute versus using transit or biking.
Which city is better for families with kids comparing Edmonds and Seattle?
Families in Seattle benefit from stronger school and playground density, hospital access, and broadly accessible errands that reduce the daily logistics burden of managing children’s schedules, healthcare, and activities. Families in Edmonds gain lower housing entry costs, more space, and integrated green space but face routine healthcare limitations, corridor-clustered grocery access, and greater car dependence for school and activity transportation. The better fit depends on whether your family prioritizes infrastructure proximity and reduced logistics friction or values residential space, outdoor access, and lower housing costs despite increased driving and planning requirements.
Do utilities cost more in Edmonds or Seattle in 2026?
Utility cost exposure depends more on housing type and size than city-level rate differences. Edmonds’ lower natural gas prices benefit households in single-family homes with gas heating, reducing per-unit costs during winter months. Seattle’s higher natural gas rates increase heating-season exposure for gas-heated homes, but the city’s more vertical housing stock and smaller average unit sizes reduce total energy consumption through shared walls and reduced square footage. Families in larger detached homes in Edmonds face lower per-unit heating costs but higher absolute usage, while couples and single adults in Seattle apartments benefit from reduced baseline energy needs despite higher per-unit gas rates.
How does grocery shopping differ between Edmonds and Seattle in 2026?
Grocery shopping in Seattle benefits from broadly accessible food and grocery options distributed throughout the city, allowing households to walk, bike, or integrate errands into daily routines without dedicated car trips. Edmonds’ corridor-clustered grocery access concentrates options along commercial strips, requiring more intentional planning and typically car-based trips to reach stores. Both cities share the same regional price parity, meaning grocery prices operate within the same elevated cost environment, but Seattle’s density and accessibility reduce the time and transportation friction of running errands, while Edmonds requires more car-based logistics and advance planning for grocery shopping.
Conclusion
The cost structure differences between Edmonds and Seattle in 2026 reflect distinct tradeoffs in housing entry barriers, transportation dependence, and daily logistics friction rather than a clear winner in overall affordability. Edmonds offers lower housing costs and single-family residential character, appealing to households prioritizing space, quieter surroundings, and lower upfront financial pressure. Seattle imposes higher housing entry costs but delivers infrastructure advantages—stronger transit and bike networks, broadly accessible errands, hospital presence, and reduced car dependence—that benefit households valuing proximity, convenience, and reduced time friction in daily life. Both cities operate within the same elevated regional cost environment, meaning financial pressure exists in both